 Global| Sep 11 2008
U.S. Trade Deficit Deepened As Oil Prices Rose
by:Tom Moeller
|in:Economy in Brief
Summary
The U.S. foreign trade deficit for July reversed its earlier improvement and deepened to $62.2B after shrinking to $58.8B in June which was deeper than reported last month. A deficit of $58.0B had been the Consensus expectation for [...]
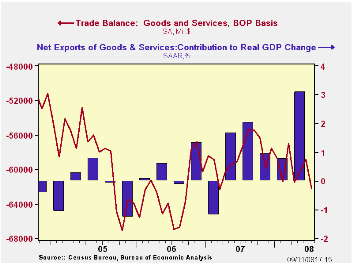
The U.S. foreign trade deficit for July reversed its earlier improvement and deepened to $62.2B after shrinking to $58.8B in June which was deeper than reported last month. A deficit of $58.0B had been the Consensus expectation for July. So far this year the monthly trade deficit has averaged $60.0B, slightly deeper than the $59.4B averaged during the first seven months of 2007.
Adjusted for price inflation, the July trade deficit in goods deepened slightly to $41.2B from $40.1B in June. Year-to-date the real deficit has narrowed by more than $10.0B versus 2007 to an average $45.7B as exports surged and real import growth dropped.
During 2Q08 a narrower trade deficit added 3.1 percentage
points to real GDP growth after a 0.8 point addition during 1Q. U.S.
exports again were strong in July and they rose 2.0% m/m after a
downwardly revised 3.6% increase during June.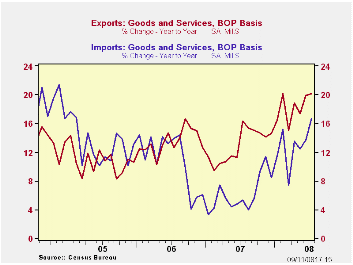
Goods exports rose during July by 3.9% (23.2% y/y) after a little-revised 4.9% jump during June. Adjusted for prices, chained dollar exports rose 2.0% (12.1% y/y). Real exports of nonauto consumer goods continued strong and surged 5.0% (17.4% y/y) after a like increase during June. Real exports of capital goods again were strong and increased 2.0% (7.8% y/y). Exports of autos, parts & engines jumped 12.6% (10.9% y/y) but real exports foods, feeds & beverages fell 7.1% (+6.3% y/y).
Exports of services again were strong and they rose 1.8% (11.5% y/y). Travel exports rose 2.0% (18.8% y/y) as during June and passenger fares rose 1.6% (31.4% y/y).
Overall, imports posted a strong 3.9% jump as petroleum imports surged 13.7% due to higher prices. Imports have nearly doubled since one year earlier. Adjusted for the higher prices, petroleum imports rose a lesser 8.0% (3.8% y/y) during July. The quantity of energy-related imports of petroleum products jumped 4.5% y/y while the average cost for a barrel of crude oil during July was $124.66 (90.1% y/y). Since July prices have fallen significantly and that should begin to reverse much of the trade deficit's deterioration.
Month-to-month, imports of nonpetroleum products during July
rose 1.1% after a little-revised 1.3% decline during June. Measured in
chained 2000 dollars nonoil imports inched up 0.3% (-2.7% y/y) after a
revised 2.0% drop during June. In chained dollars imports of capital
goods reversed just part of their June decline with a 1.2% (2.9% y/y)
increase. Real imports of automotive vehicles & parts were weak
again and they fell by 0.6% (-10.6% y/y).Chained imports of nonauto
consumer goods fell for the second consecutive month, in July by 0.4%
(+2.1% y/y).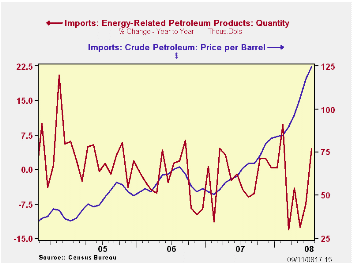
Services imports increased 1.7% (8.4% y/y) as travel imports jumped 1.5% (9.2% y/y) and passenger fares increased 3.0% (18.0% y/y).
The U.S. trade deficit in goods with China deepened slightly m/m to $21.4B. The deficit with China during the first seven months of this year was roughly the same as during the first seven months of 2007. Growth in exports to China spiked to 34.3% y/y in July and imports rose 9.5%. That was down from the 11.7% increase during all of 2007. With Japan, the trade deficit deepened slightly to $6.3B as exports fell 5.8% (+16.2% y/y) and imports dropped 1.2% (-6.2% y/y).
Did Large Recalls of Chinese Consumer Goods Lower U.S. Imports from China? from the Federal Reserve Bank of San Francisco can be found here.
| Foreign Trade | July | June | Y/Y | 2007 | 2006 | 2005 |
|---|---|---|---|---|---|---|
| U.S. Trade Deficit | $62.2B | $58.8B | $57.3B (7/07) | $700.3 | $753.3 | $711.6B |
| Exports - Goods & Services | 3.3% | 3.7% | 20.1% | 13.0% | 13.5% | 10.6% |
| Imports - Goods & Services | 3.9% | 2.1% | 16.8% | 6.1% | 10.8% | 12.8% |
| Petroleum | 13.7% | 16.4% | 88.8% | 9.4% | 20.1% | 39.6% |
| Nonpetroleum Goods | 1.1% | -1.3% | 4.5% | 4.8% | 9.1% | 10.3% |
by Tom Moeller September 11, 2008
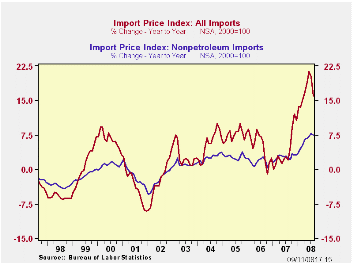
U.S. import prices overall slid 3.7% last month. The decline followed a revised 0.2% July uptick and gains between 2.0% and 3.0% during the prior four months. The August decline was double expectations for a 1.5% drop.
The decline was paced by a 12.8% drop in petroleum prices and the price index returned nearer to its April level. This month imported crude petroleum prices already are down another 10% .
Less petroleum, import prices slipped 0.3 after a downwardly revised 0.7% July increase. During the last three months prices rose at a 4.6% annual rate, down sharply from the 12-13% growth of this past spring.
Growth
in import prices, eventually, will slow further given the recent rise
in the foreign exchange value of the dollar. During
the last ten years there has been a 66% (negative) correlation between
the nominal trade-weighted exchange value of the US dollar vs. major
currencies and the y/y change in non oil import prices. The correlation
is a reduced 47% against a broader basket of currencies.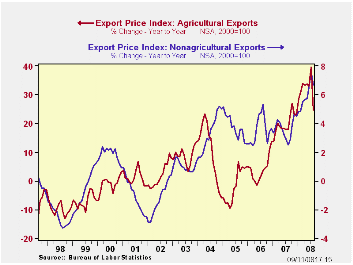
Prices for industrial supplies & materials excluding oil fell 1.7% and reversed the July gain. Three-month growth of 13.7% (AR) is down due to slower gains in prices for iron & steel products, unfinished metals and chemicals. These detailed import price series can be found in the Haver USINT database.
Capital goods import prices slipped 0.1% after a downwardly revised 0.2% increase during July. On a three-month basis prices were unchanged. Less the lower prices of computers, capital goods prices rose 0.2% after a 0.7% July rise. Three month growth of 4.4% was half its peak and they rose 2.7% last year. Prices of computers, peripherals & accessories fell 1.0% last month, about as they did during the prior three months.
Finally, prices for nonauto consumer goods were unchanged last month and the 1.5% rate of increase during the last three months is down from the 5.9% peak earlier this year. The diminished rate of increase for durables of 1.6% is notable.
Total export prices reversed their July surge and fell 1.7% as agricultural prices slumped 9.6% (+24.8% y/y). Nonagricultural export prices reversed their July increase and fell 0.7% (+6.7% y/y).
| Import/Export Prices (NSA, %) | August | July | Y/Y | 2007 | 2006 | 2005 |
|---|---|---|---|---|---|---|
| Import - All Commodities | -3.7 | 0.2% | 16.0% | 4.2% | 4.9% | 7.5% |
| Petroleum | -12.8 | -1.0 | 52.0 | 11.6 | 20.6 | 37.6 |
| Non-petroleum | -0.3 | 0.7 | 7.5 | 2.7 | 1.7 | 2.7 |
| Export- All Commodities | -1.7 | 1.5 | 8.2 | 4.9 | 3.6 | 3.2 |
by Tom Moeller September 11, 2008
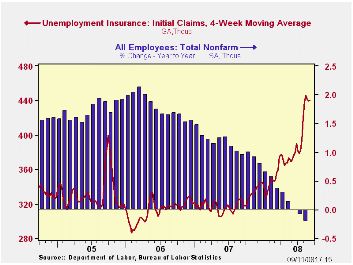
Initial claims for unemployment insurance slipped last week to 445,000 but the prior week's level was revised higher to 451,000.
The four-week moving average held roughly stable at 440,000 (35.4% y/y) and remained near the highest level since near the end of the 2001 recession. During July claims averaged 393,000.
A claims level below 400,000 typically has been associated
with positive growth in nonfarm payrolls. During the last ten years
there has been a (negative) 76% correlation between the level of
initial claims and the m/m change in nonfarm payroll employment. Over
the longer period of time, the level of claims for jobless insurance
has not trended higher with the size of the labor force due to a higher
proportion of self-employed workers who are not eligible for benefits.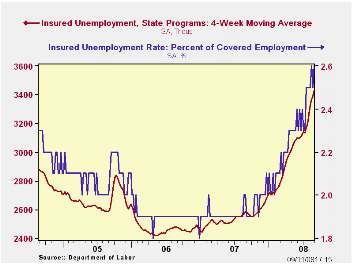
Continuing claims for unemployment insurance during the latest week rose 122,000 to a new cycle-high. Continuing claims provide some indication of workers' ability to find employment and they lag the initial claims figures by one week.
The insured rate of unemployment ticked higher to 2.6%, the highest level since late-2003.
| Unemployment Insurance (000s) | 09/05/08 | 08/30/08 | Y/Y | 2007 | 2006 | 2005 |
|---|---|---|---|---|---|---|
| Initial Claims | 445 | 451 | 38.2% | 322 | 313 | 331 |
| Continuing Claims | -- | 3,525 | 35.7% | 2,552 | 2,459 | 2,662 |
by Tom Moeller September 11, 2008
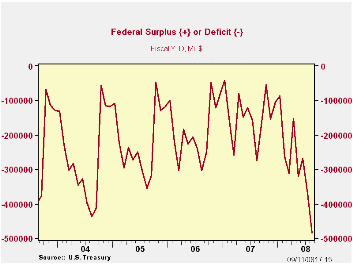
The U.S. government's August budget deficit of $111.9B was roughly equal to the deficit of last August of $117.0B. Moreover, based on expectations formed by Public Debt Transactions from the Daily Treasury Statement, the budget surplus roughly equaled the Consensus forecast for a deficit of $105B. The Treasury Statement figures are available in Haver's DAILY database.
Like prior months, however, that is where the good news ends on the Federal budget front. For the first eleven months of FY08 the government ran a budget deficit of $483.4B which was up from the deficit of $274.4B during the first eleven months of FY07. The weak economy has limited government receipts and swelled expenditures.
For the fiscal year to date federal receipts fell 1.4% from a
year earlier, the third negative comparison in a row and it compared to
positive 7.5% y/y growth during the first eleven months of FY07. Higher
unemployment pulled the growth in individual income tax receipts (44%
of total receipts) to a negative 2.7% this year versus positive 11.5%
growth during all of FY07. That was the weakest growth since a
shortfall in mid-2004. Despite higher unemployment, withheld income
taxes still grew 3.3%, but that was about one-third the growth of a
year earlier. Growth in non-withheld taxes similarly fell to just 5.1%,
also one-third of the growth during the first eleven months of FY07.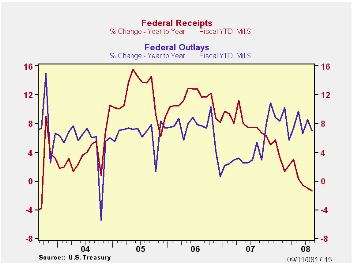
Lower corporate profitability provided a further crimp to government revenues. Corporate income taxes (13% of total receipts) fell 6.9% from receipts during the first eleven months of FY07. During FY07 they rose 8.5% during the first eleven months.
Unemployment insurance contributions fell 3.3% FYTD due to negative employment growth while Federal excise taxes fell 2.3%. Estate and gift taxes rose 11.8%.
U.S. net outlays grew 7.0% during the first eleven months of FY08, up from 5.3% growth during FY07's first eleven months. Growth in defense spending (19% of total outlays) led the acceleration with an 11.7% gain, up from 7.0% growth one year earlier. Transportation spending grew 6.2%, up from 4.2% growth in FY07's first eleven months.
As unemployment rose, growth in outlays for income security (15% of outlays) surged to 17.7% from 5.7% one year earlier. Medicare expenditures (12% of outlays) grew a slower 4.4% but health spending (10% of total outlays) was near-constant at a 4.8% growth rate. Growth in interest expense also held steady at 4.5%.
The Government's financial data is available in Haver's USECON database.
The Budget and Economic Outlook: An Update from the Congressional Budget Office can be found here
| US Government Finance | August | July | Y/Y | FY 2007 | FY 2006 | FY 2005 |
|---|---|---|---|---|---|---|
| Budget Balance | $-111.9B | $-102.8B | $-117.0B (8/07) | -$162.0B | -$248.2B | -$318.7B |
| Net Revenues | $157.0 | $160.5B | -5.7% | 6.7% | 11.8% | 14.1% |
| Net Outlays | $268.9 | $263.3B | -5.1% | 2.8% | 7.4% | 7.6% |
by Robert Brusca September 11, 2008
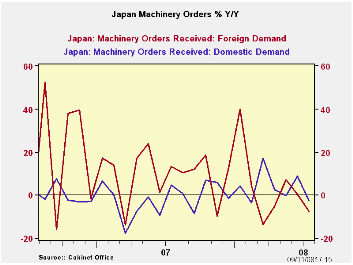
Japan’s machinery orders fell sharply in July while the so called core order series fell, but by less than had been expected. Domestic orders have been listless for a year while foreign orders have been getting quite weak since early this year. Japan's two largest export markets are China and the US and both are slowing. The US slowdown has hit Japan especially hard. Still, orders is a volatile series. Even the so-called core is very volatile once the large projects are removed.
| Japan Machinery Orders | |||||||
|---|---|---|---|---|---|---|---|
| m/m % | Saar % | ||||||
| SA | Jul-08 | Jun-08 | May-08 | 3-Mos | 6-Mos | 12-Mos | 12-Mo Ago |
| Total | -8.5% | -4.8% | 10.8% | -13.3% | -36.6% | -4.7% | 8.0% |
| Core Orders* | -3.9% | -2.6% | 10.4% | 13.9% | -23.1% | -4.8% | 7.8% |
| Total Orders | |||||||
| Foreign Demand | -14.4% | -12.1% | 21.1% | -30.8% | -51.8% | -7.4% | 13.3% |
| Domestic demand | -5.2% | 3.6% | 2.3% | 2.0% | -12.1% | -2.4% | 4.7% |
| *Excluding ships and electric power. | |||||||

Tom Moeller
AuthorMore in Author Profile »Prior to joining Haver Analytics in 2000, Mr. Moeller worked as the Economist at Chancellor Capital Management from 1985 to 1999. There, he developed comprehensive economic forecasts and interpreted economic data for equity and fixed income portfolio managers. Also at Chancellor, Mr. Moeller worked as an equity analyst and was responsible for researching and rating companies in the economically sensitive automobile and housing industries for investment in Chancellor’s equity portfolio. Prior to joining Chancellor, Mr. Moeller was an Economist at Citibank from 1979 to 1984. He also analyzed pricing behavior in the metals industry for the Council on Wage and Price Stability in Washington, D.C. In 1999, Mr. Moeller received the award for most accurate forecast from the Forecasters' Club of New York. From 1990 to 1992 he was President of the New York Association for Business Economists. Mr. Moeller earned an M.B.A. in Finance from Fordham University, where he graduated in 1987. He holds a Bachelor of Arts in Economics from George Washington University.
More Economy in Brief


