 Global| Aug 12 2008
U.S. Trade Deficit Again Unexpectedly Narrowed As Exports Surged
by:Tom Moeller
|in:Economy in Brief
Summary
During June, the U.S. foreign trade deficit narrowed again to $56.8B after shrinking to the little-revised $59.2B in May. A deficit of $61.9B had been the Consensus expectation for June. So far this year the monthly trade deficit has [...]
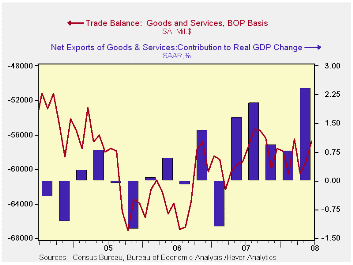
During June, the U.S. foreign trade deficit narrowed again to $56.8B after shrinking to the little-revised $59.2B in May. A deficit of $61.9B had been the Consensus expectation for June. So far this year the monthly trade deficit has averaged $58.6B versus $59.7B during the first six months of 2007.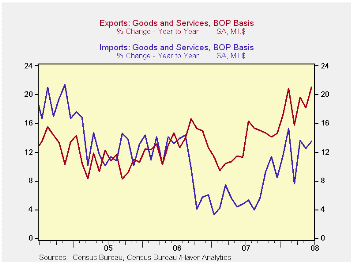
In constant dollars the picture is even more encouraging. The trade deficit in goods narrowed to $39.1B from $43.5B in May and in 2008 the real deficit has narrowed by more than $10B to an average $46.3B. For the second quarter, the initial estimate indicated that the narrower trade deficit added 2.4 percentage points to real GDP growth, a figure that should be revised up. That was after additions between 0.8 and 1.4 percentage points during the prior three quarters.
U.S. exports surged 4.0% m/m during June after an upwardly revised 1.2% increase in May. Annualized, exports have risen at a 26.6% annualized rate during the last six months versus 13.0% growth during 2006 and 2007.
Goods exports rose 5.1% during June after an upwardly revised 0.9% gain in May. Adjusted for prices, chained dollar exports rose 4.0% (13.4% y/y). Real exports of nonauto consumer goods jumped 5.3% (16.7% y/y) after a 0.2% dip during May. Exports of capital goods also were strong and rose 3.0% (10.1% y/y). Exports of autos, parts & engines surged 5.7% (7.4% y/y) while real exports foods, feeds & beverages jumped 5.9% (19.2% y/y).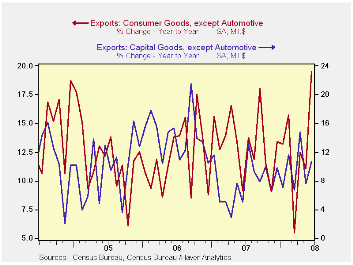
Exports of services rose 1.4% (16.7% y/y) and that followed an upwardly revised 2.0% jump during May. Travel exports rose 0.6% (21.9% y/y) while passenger fares surged again, in June by 4.4% (33.4% y/y).
Petroleum imports did bounce back in June by 14.6% after the modest decline during May. However, adjusted for the higher prices, petroleum imports recovered only half of their May decline with a 4.8% (-8.3% y/y) increase. The quantity of energy-related imports of petroleum products fell 7.6% y/y while the average cost for a barrel of crude oil was $117.13 (92.0% y/y) in June.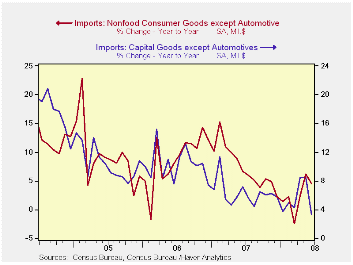
Month-to-month, imports of nonpetroleum products fell 1.4% during June. Measured in chained 2000 dollars these imports fell 0.6% (-3.9% y/y) after a revised 1.9% plop during May. In chained dollars imports of capital goods surged cratered by 3.4% (+1.4% y/y). Chained imports of nonauto consumer goods also fell a hard 1.6% (+0.7% y/y) after a 3.9% May pop. Real imports of automotive vehicles & parts ticked up 0.3% (-6.7% y/y) following their 4.6% drop during May.
Services imports increased 1.0% (9.9% y/y). Travel imports ticked lower by 0.1% (+9.4% y/y) while passenger fares rose 4.4% (18.2% y/y).
With China, the U.S. trade deficit in goods was roughly steady m/m at $21.4B. The deficit with China during the first six months of this year is the same as during last year's first six months. Exports to China rose 8.5% y/y during June and import growth moderated to just 2.9%. With Japan the trade deficit deepened to $6.1B as exports fell 3.2% (+10.3% y/y) and imports rose 7.9% (2.5% y/y).
Challenging Times... from the Federal Reserve Bank of Kansas City is available here.
The Evolution of the World Income Distribution from the Federal Reserve Bank of Philadelphia can be found here.
| Foreign Trade | June | May | Y/Y | 2007 | 2006 | 2005 |
|---|---|---|---|---|---|---|
| U.S. Trade Deficit | $56.8B | $59.2B | $59.1B (6/07) | $700.3 | $753.3 | $711.6B |
| Exports - Goods & Services | 4.0% | 1.2% | 21.1% | 13.0% | 13.5% | 10.6% |
| Imports - Goods & Services | 1.8% | 0.3% | 13.5% | 6.1% | 10.8% | 12.8% |
| Petroleum | 14.6% | -1.8% | 67.7% | 9.4% | 20.1% | 39.6% |
| Nonpetroleum Goods | -1.4% | 1.2% | 3.8% | 4.8% | 9.1% | 10.3% |

Tom Moeller
AuthorMore in Author Profile »Prior to joining Haver Analytics in 2000, Mr. Moeller worked as the Economist at Chancellor Capital Management from 1985 to 1999. There, he developed comprehensive economic forecasts and interpreted economic data for equity and fixed income portfolio managers. Also at Chancellor, Mr. Moeller worked as an equity analyst and was responsible for researching and rating companies in the economically sensitive automobile and housing industries for investment in Chancellor’s equity portfolio. Prior to joining Chancellor, Mr. Moeller was an Economist at Citibank from 1979 to 1984. He also analyzed pricing behavior in the metals industry for the Council on Wage and Price Stability in Washington, D.C. In 1999, Mr. Moeller received the award for most accurate forecast from the Forecasters' Club of New York. From 1990 to 1992 he was President of the New York Association for Business Economists. Mr. Moeller earned an M.B.A. in Finance from Fordham University, where he graduated in 1987. He holds a Bachelor of Arts in Economics from George Washington University.
More Economy in Brief


