 Global| Aug 13 2004
U.S. Trade Deficit A New Record
by:Tom Moeller
|in:Economy in Brief
Summary
The U.S. foreign trade deficit surged to another record high in June of $55.8B. Consensus expectations had been for a deficit of $46.7B. Total imports jumped 3.3% as petroleum imports surged 17.8% (46.2% y/y). Imports of non-petroleum [...]
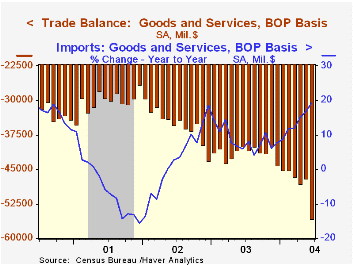
The U.S. foreign trade deficit surged to another record high in June of $55.8B. Consensus expectations had been for a deficit of $46.7B.
Total imports jumped 3.3% as petroleum imports surged 17.8% (46.2% y/y). Imports of non-petroleum goods also rose a strong 1.8% (17.4% y/y) following an upwardly revised 1.0% rise in May.
Exports slumped 4.3% following the downwardly revised 2.7% jump to a record high. Month to month weakness was across the board and pronounced.
By country, the US trade deficit with China deepened m/m to $14.2.0B ($124.1B in 2003) as imports surged 12.7% (39.6% y/y). The US trade deficit with Japan also deepened to $6.3B ($66.0B in 2003) on an 11.6% 13.0% y/y) jump in imports.
| Foreign Trade | June | May | Y/Y | 2003 | 2002 | 2001 |
|---|---|---|---|---|---|---|
| Trade Deficit | $55.8B | $46.9B | $40.0B(6/03) | $496.5B | $421.7B | $362.7B |
| Exports - Goods & Services | -4.3% | 2.7% | 9.7% | 4.6% | -3.1% | -6.0% |
| Imports - Goods & Services | 3.3% | 1.0% | 19.3% | 8.5% | 2.1% | -5.5% |
by Tom Moeller August 13, 2004
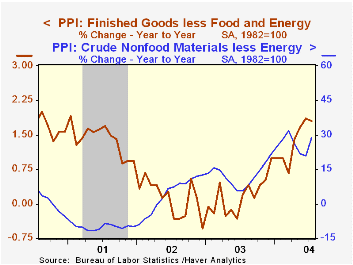
The July PPI for finished goods rose a tame 0.1% versus Consensus expectations for a 0.3% rise.The "core" PPI also was well behaved, rising an expected 0.1%.
Finished energy prices bounced up 2.3% (11.3% y/y) after the 1.6% June decline. Offsetting that gain was a 1.6% (+4.9% y/y) decline in food prices.
Prices of finished consumer goods less food & energy rose 0.1% (1.8% y/y) for the second month reflecting flat consumer durable prices and a 0.2% gain in core non-durable prices.
Finished capital goods prices rose 0.1% (1.6% y/y).
The fireworks in the PPI report was an 8.6% increase in core crude goods prices, a record gain which reflected a 32.2% (NSA) rise in iron & steel scrap prices. Other metals prices also were quite strong.
Intermediate goods prices were strong as well with a 0.8% gain. Core intermediate prices rose the same 0.5% (6.4% y/y) as in June, last month reflecting higher paperboard and box prices.
"Will Oil Prices Choke Growth?" from the Federal Reserve Bank of St. Louis can be found here.
| Producer Price Index | July | June | Y/Y | 2003 | 2002 | 2001 |
|---|---|---|---|---|---|---|
| Finished Goods | 0.1% | -0.3% | 4.0% | 3.2% | -1.3% | 2.0% |
| Core | 0.1% | 0.2% | 1.8% | 0.2% | 0.1% | 1.4% |
| Intermediate Goods | 0.8% | 0.5% | 7.7% | 4.7% | -1.5% | 0.4% |
| Core | 0.5% | 0.5% | 6.4% | 2.0% | -0.5% | -0.1% |
| Crude Goods | -0.2% | 1.6% | 22.1% | 25.1% | -10.6% | 0.3% |
| Core | 8.6% | -0.5% | 28.8% | 12.4% | 3.8% | -10.0% |
by Tom Moeller August 13, 2004
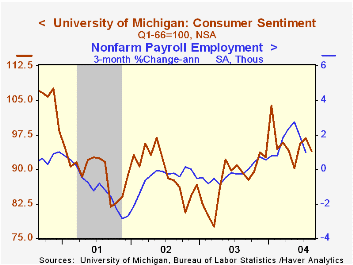
The University of Michigan’s consumer sentiment index for mid-August fell unexpectedly to 94.0 from 96.7 in July. Consensus expectations had been for a rise to 98.0.
During the last ten years there has been a 75% correlation between the level of consumer sentiment and the y/y change in real PCE.
The expectations sub-index fell to 84.7, the lowest level since May. The index of current economic conditions rose to 108.4, its level since January.
The University of Michigan survey is not seasonally adjusted.The mid-month survey is based on telephone interviews with 250 households nationwide on personal finances and business and buying conditions. The survey is expanded to a total of 500 interviews at month end.
| University of Michigan | Mid-Aug | July | Y/Y | 2003 | 2002 | 2001 |
|---|---|---|---|---|---|---|
| Consumer Sentiment | 94.0 | 96.7 | 5.3% | 87.6 | 89.6 | 89.2 |
| Current Conditions | 108.4 | 105.2 | 8.7% | 97.2 | 97.5 | 100.1 |
| Consumer Expectations | 84.7 | 91.2 | 2.7% | 81.4 | 84.6 | 82.3 |

Tom Moeller
AuthorMore in Author Profile »Prior to joining Haver Analytics in 2000, Mr. Moeller worked as the Economist at Chancellor Capital Management from 1985 to 1999. There, he developed comprehensive economic forecasts and interpreted economic data for equity and fixed income portfolio managers. Also at Chancellor, Mr. Moeller worked as an equity analyst and was responsible for researching and rating companies in the economically sensitive automobile and housing industries for investment in Chancellor’s equity portfolio. Prior to joining Chancellor, Mr. Moeller was an Economist at Citibank from 1979 to 1984. He also analyzed pricing behavior in the metals industry for the Council on Wage and Price Stability in Washington, D.C. In 1999, Mr. Moeller received the award for most accurate forecast from the Forecasters' Club of New York. From 1990 to 1992 he was President of the New York Association for Business Economists. Mr. Moeller earned an M.B.A. in Finance from Fordham University, where he graduated in 1987. He holds a Bachelor of Arts in Economics from George Washington University.
More Economy in Brief


