 Global| Apr 11 2008
U.S. Total Import Prices Surged, Ex. Oil Jumped
by:Tom Moeller
|in:Economy in Brief
Summary
Overall import prices surged 2.8% last month. Except for a 3.2% jump last November, the gain was the largest since 1990 and by far outpaced Consensus expectations for a 0.2% uptick. Petroleum prices rose 9.1% as crude oil prices [...]
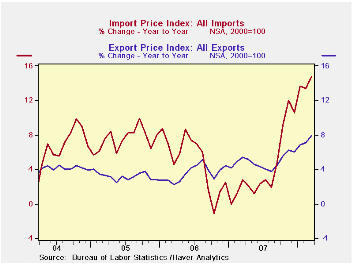
Overall import prices surged 2.8% last month. Except for a 3.2% jump last November, the gain was the largest since 1990 and by far outpaced Consensus expectations for a 0.2% uptick.
Petroleum prices rose 9.1% as crude oil prices surged. Imported crude petroleum prices already are up another 4% this month versus March.
Less petroleum, import prices jumped 1.1%. That was the largest m/m increase on record, pushed higher by the lower foreign exchange value of the dollar.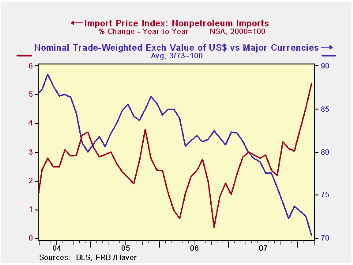
During the last ten years there has been a 66% (negative) correlation between the nominal trade-weighted exchange value of the US dollar vs. major currencies and the y/y change in non oil import prices. The correlation is a reduced 47% against a broader basket of currencies.
Prices for industrial supplies & materials excluding petroleum surged again, last month by 3.6% (14.7% y/y) after the 2.7% February jump. Finished metal prices have been strong (16.1% y/y) and iron & steel mill product prices were up 19.5% y/y. The detailed import price series can be found in the Haver USINT database.
Capital goods import prices rose 1.0% y/y but less the lower prices of computers capital goods prices rose 3.3%, the fastest rate of gain since 1995. Prices of computers, peripherals and accessories fell 4.5% y/y.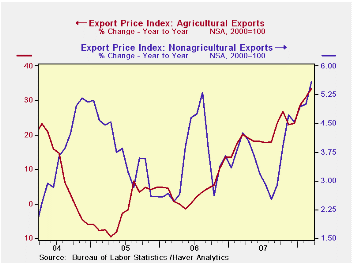
Finally, prices for nonauto consumer goods imports rose 2.7% y/y during March, the quickest gain since 1992. Price gains were accelerated across the board.
Total export prices also have been quite strong led by a 33.4% y/y surge in agricultural prices. Nonagricultural export prices also were strong and rose 5.6% y/y, the quickest since 1995.
| Import/Export Prices (NSA) | March | February | Y/Y | 2007 | 2006 | 2005 |
|---|---|---|---|---|---|---|
| Import - All Commodities | 2.8% | 0.2% | 14.8% | 4.2% | 4.9% | 7.5% |
| Petroleum | 9.1% | -1.9% | 60.0% | 11.6% | 20.6% | 37.6% |
| Non-petroleum | 1.1% | 0.7% | 5.4% | 2.7% | 1.7% | 2.7% |
| Export- All Commodities | 1.5% | 1.1% | 7.9% | 4.9% | 3.6% | 3.2% |

Tom Moeller
AuthorMore in Author Profile »Prior to joining Haver Analytics in 2000, Mr. Moeller worked as the Economist at Chancellor Capital Management from 1985 to 1999. There, he developed comprehensive economic forecasts and interpreted economic data for equity and fixed income portfolio managers. Also at Chancellor, Mr. Moeller worked as an equity analyst and was responsible for researching and rating companies in the economically sensitive automobile and housing industries for investment in Chancellor’s equity portfolio. Prior to joining Chancellor, Mr. Moeller was an Economist at Citibank from 1979 to 1984. He also analyzed pricing behavior in the metals industry for the Council on Wage and Price Stability in Washington, D.C. In 1999, Mr. Moeller received the award for most accurate forecast from the Forecasters' Club of New York. From 1990 to 1992 he was President of the New York Association for Business Economists. Mr. Moeller earned an M.B.A. in Finance from Fordham University, where he graduated in 1987. He holds a Bachelor of Arts in Economics from George Washington University.
More Economy in Brief


