 Global| Aug 19 2013
U.S. State Unemployment Rates Vary By Three Times, Highest-to-Lowest
by:Tom Moeller
|in:Economy in Brief
Summary
The overall U.S. rate of unemployment of 7.4% stood last month at its lowest level since December 2008. Improvement has registered across the country and gained momentum in many states. While the country's overall jobless rate is down [...]
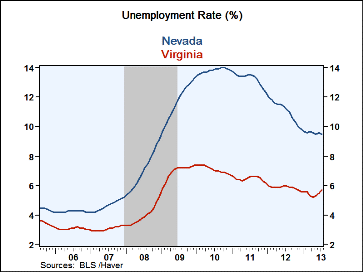
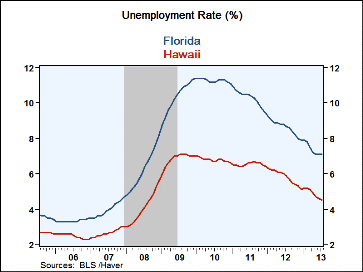
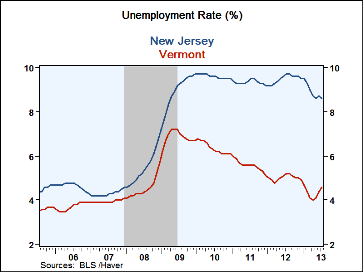
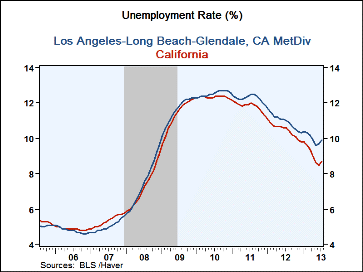
The overall U.S. rate of unemployment of 7.4% stood last month at its lowest level since December 2008. Improvement has registered across the country and gained momentum in many states. While the country's overall jobless rate is down 2.2 percentage points from the peak 2010 average, Nevada's 9.5% rate is down 4.2 percentage points from 2010. Nevertheless, it remains three times the rate in North Dakota. Florida's 7.1% unemployment rate similarly is 4.2 percentage points below its annual peak. Another state with relatively high unemployment is Michigan. Here again, however, its 8.8% jobless rate is 3.9 percentage points lower than during 2010. Finally, California's rate of 8.7% is 3.6 percentage points below the 2010 high of 12.3%.
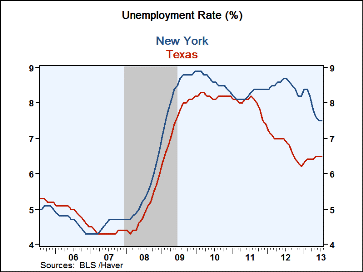
States with relatively low unemployment have shown comparatively little improvement from the highs. In Texas, for example, the 6.5% jobless rate is down just 1.7 percentage points from 2010. Virginia's 5.7% jobless rate is down only 1.4 percentage points from the high of 7.1%. Utah has realized a bit more of an improvement. Its 4.6% unemployment rate is down 2.3 percentage points from the 6.9% high. The smallest improvement in the jobless rate has been in Nebraska where the current 4.2% unemployment rate is just 0.5 percentage points below the 4.7% high.
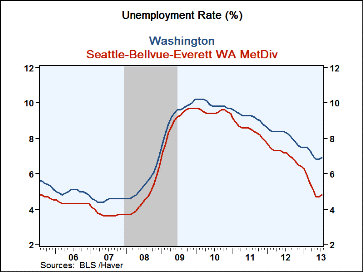
The household employment survey also produces data on individual metropolitan areas. These figures, in a few circumstances, differ widely from the state numbers. Florida's 7.1% unemployment rate, for example differs greatly from 8.2% in the Miami metro area, although Miami's rate is down from 12.4% in 2010. Michigan's 8.8% rate also is under the 9.4% rate around Detroit. New York state's 7.5% is below the 8.4% in New York City while California's 8.7% rate is under 9.9% around Los Angeles. Running close to one another are the Illinois unemployment rate of 9.2% and the 9.4% rate around Chicago. Also, Ohio's 7.2% rate of joblessness is near Cleveland's of 7.1%. Working the other way is Washington state's 6.9% jobless rate as it by far exceeds Seattle's 4.8%.
State unemployment figures are available in Haver's EMPLR database.
Tom Moeller
AuthorMore in Author Profile »Prior to joining Haver Analytics in 2000, Mr. Moeller worked as the Economist at Chancellor Capital Management from 1985 to 1999. There, he developed comprehensive economic forecasts and interpreted economic data for equity and fixed income portfolio managers. Also at Chancellor, Mr. Moeller worked as an equity analyst and was responsible for researching and rating companies in the economically sensitive automobile and housing industries for investment in Chancellor’s equity portfolio. Prior to joining Chancellor, Mr. Moeller was an Economist at Citibank from 1979 to 1984. He also analyzed pricing behavior in the metals industry for the Council on Wage and Price Stability in Washington, D.C. In 1999, Mr. Moeller received the award for most accurate forecast from the Forecasters' Club of New York. From 1990 to 1992 he was President of the New York Association for Business Economists. Mr. Moeller earned an M.B.A. in Finance from Fordham University, where he graduated in 1987. He holds a Bachelor of Arts in Economics from George Washington University.
More Economy in Brief
 Global| Feb 05 2026
Charts of the Week: Balanced Policy, Resilient Data and AI Narratives
by:Andrew Cates


