 Global| Oct 21 2016
U.S. State Unemployment Rates Range from 2.9% to 6.9%
by:Tom Moeller
|in:Economy in Brief
Summary
The decline in the overall U.S. unemployment rate has stabilized this year around 4.9% versus 5.3% during 2015. It was half its late-2009 peak, and varied greatly amongst individual states. In today's state labor market report for [...]
The decline in the overall U.S. unemployment rate has stabilized this year around 4.9% versus 5.3% during 2015. It was half its late-2009 peak, and varied greatly amongst individual states.
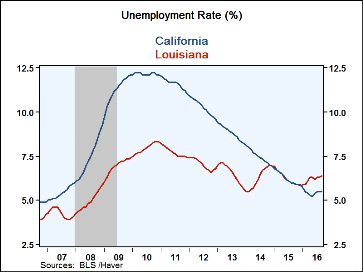
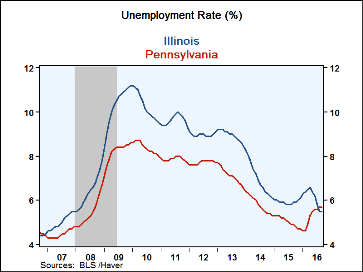
In today's state labor market report for September, unemployment in Alaska continued to top the chart at 6.9% versus 6.5% during all of last year. Louisiana also registered high unemployment at 6.4%, up slightly from the prior two years. Three other large states at the high end of the scale were Pennsylvania at 5.7%, up from 5.0% last year, California at 5.5%, down from 12.1% in 2010, and Illinois also at 5.5%, down from 10.3% in 2010.
At the bottom of the state unemployment tally were small states including South Dakota and New Hampshire, both at 2.9%. Another small state, Nebraska, was near the bottom of the range at 3.2%. There were larger states, however, which registered the lowest unemployment. Virginia was one with 4.0% unemployment with its close proximity to Washington, D.C. Minnesota at 4.0% was low along with Colorado at 3.6%.
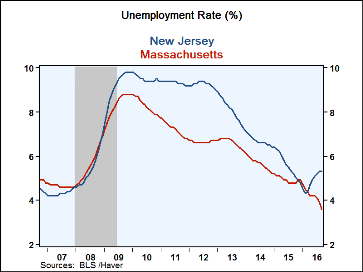
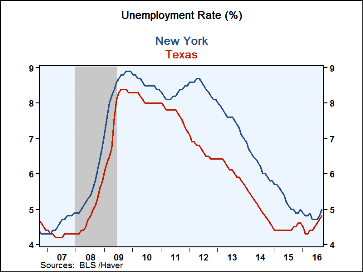
Unemployment amongst other states similarly varied greatly. Unemployment in New Jersey registered a sharp rise in unemployment to 5.3% from its low of 4.3% in February, but that's still down from 5.6% in 2015. New York's unemployment rate similarly rose to 5.0% from 4.7%. The rise was led by New York City where the unemployment rate increased to 5.8% from 5.0% in three months. Texans also experienced higher unemployment as the rate rose to 4.8% from its low of 4.3% in March. Massachusetts saw a decline in joblessness to 3.6%, down from 8.8% in January 2010.
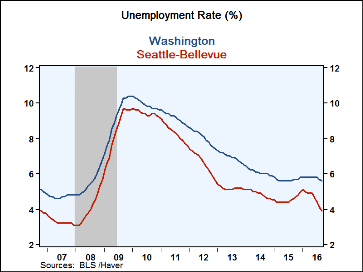
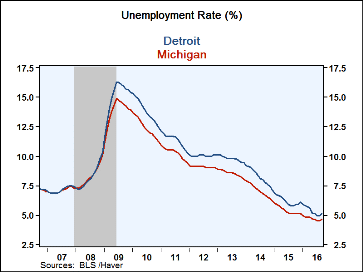
Washington state experienced relatively high unemployment with 5.6%, unless you lived around Seattle where the unemployment rate was 3.9%. A similar situation was seen in Illinois where the state's unemployment rate of 5.5% was above the 5.3% rate in Chicago. The opposite was the case in Ohio where state unemployment of 4.8% was below the 5.2% around Cleveland. Michigan's unemployment rate of 4.6% was below the 5.1% around Detroit, but that was down from 15.0% during all of 2009.
State unemployment figures are available in Haver's EMPLR database.
Consequences of Rising Income Inequality from the Federal Reserve Bank of San Francisco can be found here.
| Sep | Aug | 2015 | 2014 | 2013 | Labor Force | |
|---|---|---|---|---|---|---|
|
Total U.S. Unemployment Rate (%) |
5.0% | 4.9% | 5.3 | 6.2 | 7.4% | 159.9 million |
|
Ten States With Highest Jobless Rate |
||||||
| Alaska | 6.9 | 6.8 | 6.5 | 6.9 | 5.9 | 0.4 |
| Louisiana | 6.4 | 6.3 | 6.2 | 6.3 | 6.5 | 2.1 |
| Mississippi | 6.0 | 6.0 | 6.5 | 7.4 | 8.4 | 1.3 |
| West Virginia | 5.8 | 5.7 | 6.7 | 6.6 | 6.7 | 0.8 |
| Pennsylvania | 5.7 | 5.7 | 5.0 | 5.8 | 7.1 | 6.5 |
| Washington | 5.6 | 5.7 | 5.7 | 6.1 | 6.9 | 3.7 |
| California | 5.5 | 5.5 | 6.3 | 7.5 | 8.8 | 19.3 |
| Arizona | 5.5 | 5.8 | 6.1 | 6.7 | 7.5 | 3.2 |
| Illinois | 5.5 | 5.5 | 5.9 | 7.0 | 8.9 | 6.6 |
| Connecticut | 5.4 | 5.6 | 5.6 | 6.6 | 7.7 | 1.9 |
| Ten States With Lowest Jobless Rate | ||||||
| Iowa | 4.2 | 4.2 | 3.6 | 4.1 | 4.7 | 1.7 |
| Maine | 4.1 | 4.0 | 4.4 | 5.6 | 6.6 | 0.7 |
| Minnesota | 4.0 | 4.0 | 3.6 | 4.1 | 4.8 | 3.0 |
| Arkansas | 4.0 | 3.9 | 5.2 | 6.0 | 7.2 | 1.4 |
| Virginia | 4.0 | 3.9 | 4.4 | 5.1 | 5.6 | 4.2 |
| Idaho | 3.8 | 3.8 | 4.1 | 4.8 | 6.1 | 0.8 |
| Colorado | 3.6 | 3.8 | 3.8 | 4.9 | 6.7 | 2.8 |
| Nebraska | 3.2 | 3.2 | 2.9 | 3.2 | 3.7 | 1.0 |
| New Hampshire | 2.9 | 3.0 | 3.4 | 4.3 | 5.1 | 0.7 |
| South Dakota | 2.9 | 2.9 | 3.1 | 3.4 | 3.8 | 0.5 |
| Jobless Rate In Other Selected Large States | ||||||
| New Jersey | 5.3 | 5.3 | 5.6 | 6.7 | 8.1 | 4.6 |
| Georgia | 5.1 | 4.9 | 5.8 | 7.0 | 8.0 | 4.9 |
| New York | 5.0 | 4.8 | 5.3 | 6.3 | 7.5 | 9.6 |
| Ohio | 4.8 | 4.7 | 4.8 | 5.7 | 7.3 | 5.7 |
| Texas | 4.8 | 4.7 | 4.5 | 5.0 | 6.1 | 13.0 |
| North Carolina | 4.7 | 4.6 | 5.7 | 6.2 | 7.8 | 4.8 |
| Michigan | 4.6 | 4.5 | 5.4 | 7.1 | 8.5 | 4.7 |
| Florida | 4.7 | 4.7 | 5.3 | 6.1 | 7.0 | 9.8 |
| Wisconsin | 4.1 | 4.2 | 4.6 | 5.4 | 6.6 | 3.1 |
| Massachusetts | 3.6 | 3.9 | 4.9 | 5.7 | 6.6 | 3.6 |
Tom Moeller
AuthorMore in Author Profile »Prior to joining Haver Analytics in 2000, Mr. Moeller worked as the Economist at Chancellor Capital Management from 1985 to 1999. There, he developed comprehensive economic forecasts and interpreted economic data for equity and fixed income portfolio managers. Also at Chancellor, Mr. Moeller worked as an equity analyst and was responsible for researching and rating companies in the economically sensitive automobile and housing industries for investment in Chancellor’s equity portfolio. Prior to joining Chancellor, Mr. Moeller was an Economist at Citibank from 1979 to 1984. He also analyzed pricing behavior in the metals industry for the Council on Wage and Price Stability in Washington, D.C. In 1999, Mr. Moeller received the award for most accurate forecast from the Forecasters' Club of New York. From 1990 to 1992 he was President of the New York Association for Business Economists. Mr. Moeller earned an M.B.A. in Finance from Fordham University, where he graduated in 1987. He holds a Bachelor of Arts in Economics from George Washington University.


