 Global| Mar 09 2010
U.S. Small Business Optimism Slips
by:Tom Moeller
|in:Economy in Brief
Summary
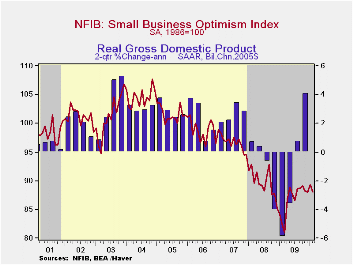
The recession has been over for nearly nine months and that has done little to improve small business' mood. The National Federation of Independent Business (NFIB) reported their February small business optimism index retraced the [...]
 The
recession has been over for nearly nine months and that has done little
to improve small business' mood. The National Federation of Independent
Business (NFIB) reported their February small business optimism index
retraced the January gain and slipped to 88.0. Since the first quarter
of last year the index has been hovering near that level. During the
last ten years there has been an 85% correlation between the level of
the NFIB index and the two-quarter change in real GDP.
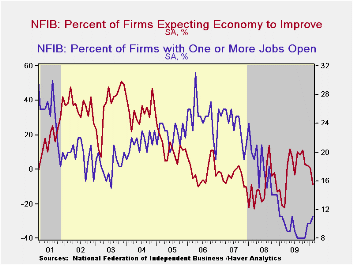
Reduced expectations for overall economic improvement pulled this measure back to its lowest level since March of last year as a majority of firms saw further economic deterioration. Expectations for sales in six months were neutral and the percentage thinking that now was a good time to expand the business fell to four percent, its lowest since March '09. Expectations for an easing of credit market conditions were skewed to further tightening and that reading is little changed since the Fall of 2008. Offsetting a piece of this deterioration was that fewer firms were planning to reduce inventory levels; in fact, it was the fewest in over a year.
Hiring plans remain restrained. The percentage of firms with one or more job openings improved slightly to its highest level since last spring but the percentage planning to increase hiring further has been moving sideways. During the last ten years there has been a 74% correlation between the NFIB employment percentage and the six-month change in nonfarm payrolls.
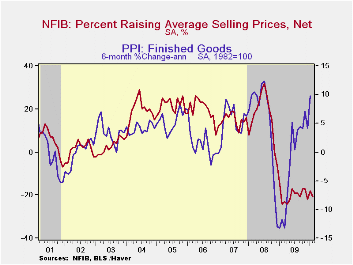
On the pricing front, weakness continued. The percentage of firms actually raising prices slipped to -21% (indicating deflation) and remained near the record low. During the last ten years there has been a 51% correlation between the six-month change in the producer price index and the level of the NFIB price index. However, the percentage of firms planning to raise prices improved to its highest level since late-2008. Finally, the percentage planning to raise worker compensation improved to its highest since late-2008.
The most important problems seen by business were poor sales (34%), taxes (23%, close to its highest level since 2007), government requirements (12%), insurance cost & availability (7%), competition from large businesses (6%) and inflation (3%).
About 24 million small businesses exist in the United States. Small business creates 80% of all new jobs in America and the NFIB figures can be found in Haver's SURVEYS database.
| Nat'l Federation of Independent Business | February | January | December | Feb.'09 | 2009 | 2008 | 2007 |
|---|---|---|---|---|---|---|---|
| Small Business Optimism Index (SA, 1986=100) | 88.0 | 89.3 | 88.0 | 82.6 | 86.7 | 89.8 | 96.7 |
| Percent of Firms Expecting Economy To Improve | -9 | 1 | 2 | -21 | -0 | -10 | -4 |
| Percent of Firms With One or More Job Openings | 11 | 10 | 10 | 11 | 9 | 18 | 24 |
| Percent of Firms Reporting That Credit Was Harder To Get | 12 | 14 | 15 | 13 | 14 | 9 | 6 |
| Percent of Firms Raising Avg. Selling Pric1es (Net) | -21 | -18 | -22 | -24 | -20 | 17 | 15 |
by Tom Moeller March 09, 2010
 Gasoline
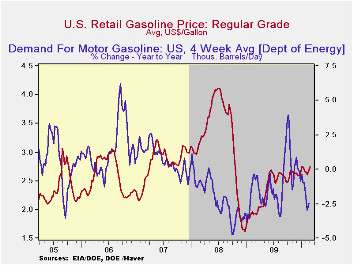
prices continued their rally. At $2.75 per gallon last week, the pump
price for regular gasoline was at the highest level since
January which was the highest level since September 2008. Yesterday,
the spot market price for a gallon of regular gasoline increased to
$2.18, also its highest since 2008. The figures are reported by the
U.S. Department of Energy and can be found in Haver's WEEKLY
& DAILY databases.
The price for a barrel of light sweet crude (WTI) rose last week to $80.19 though it remained down from the early-January high of $82.59. Nevertheless, prices have risen from $71.53 early this past December and are more than double the December 2008 low of $32.37. Yesterday, the spot price rose further to $81.87.· Demand for gasoline fell 2.5% last week versus one year ago. That decline compared to a 3.9% increase at the beginning of October. The demand for residual fuel oil spiked by one-third with falling temperatures in the Northeast & Midwest. However, distillate demand fell 7.7% y/y, a decline more moderate than the 21.6% y/y shortfall at the beginning of last July. Inventories of crude oil and petroleum products slipped in February but were up 1.0% from one year ago.
U.S. natural gas prices fell last week to an average $4.75 per mmbtu (+11.8% y/y) from the high of $6.50 early in January. Nevertheless, prices remained double the September low.
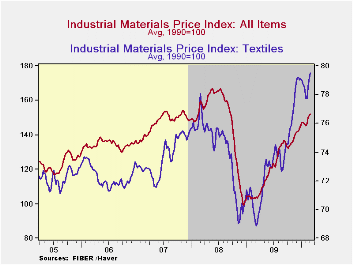
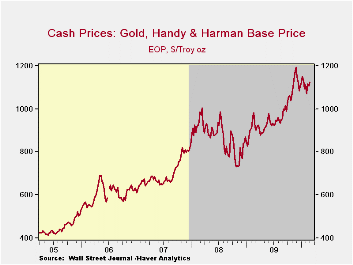
Outside of energy, commodity prices also have been strong. Copper has led the gain as prices have more-than doubled since early last year. Scrap steel prices remain strong with a doubling during the same period. Aluminum prices have leveled off since December but remain up by two-thirds since the 2009 low. With improved housing activity has come strength in lumber prices which have risen more than 50% since early-2009. Cotton prices also have nearly doubled with improvement in consumer spending. In the agricultural area, prices of foodstuffs including wheat, corn & butter, as well as livestock have risen by one-half. Finally, gold prices near $1,126.50/pound have risen 50% since the fall of '08 and have roughly tripled since 2001.
The energy & commodity price data can be found in Haver's WEEKLY database while the daily figures are in DAILY. The gasoline demand figures are in OILWKLY.
| Weekly Prices | 03/01/10 | 03/01/10 | 02/22/10 | Y/Y | 2009 | 2008 | 2007 |
|---|---|---|---|---|---|---|---|
| Retail Regular Gasoline ($ per Gallon, Regular) | 2.75 | 2.70 | 2.66 | 41.7% | 2.35 | 3.25 | 2.80 |
| Light Sweet Crude Oil, WTI ($ per bbl.) | 80.19 | 79.26 | 78.30 | 85.4% | 61.39 | 100.16 | 72.25 |
by Robert Brusca March 9, 2010
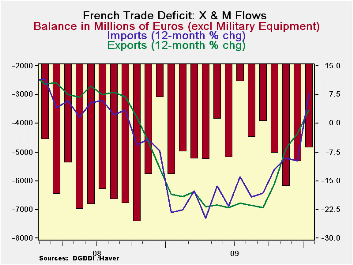
French exports and imports show a classic impact on those two flows as the domestic and global recessions hit. Now that recovery is in gear, the trade flows reflect that as well. Exports and imports plunged at the onset of the recession, imports fell because French domestic demand shriveled up; exports contracted because foreign demand shut down. The impact on the balance of trade was erratic. Generally, however, the size of the French goods trade deficit was reduced. But late in 2009 the trade deficit began to surge again reaching a monthly maximum (deficit) of over €6bln. But over the last two months this bulge in the deficit has diminished.
Exports have outpaced imports Yr/Yr, nearly doubling the growth rate of imports. Over six months exports contracted as imports began to surge. But over the last three months exports are back solidly outperforming imports, helping to shrink the French deficit.
The Yr/Yr trends in the chart tell a broad-brush story of surging trends. Both exports and imports are on a clear and solid upswing over that period. Over shorter periods export and import growth both are more chaotic. But the year-over-year statics tell a clear story of an international sector in rebound. Trade figures across the globe echo these same trends. Trade flows tell a story of an international economy in a clear state of rebound not a story of tentative and sputtering domestic growth which is the story we are often fed about the various national expansions. Why do the trade data speak clearly to the subject of revival while various national data do not? It is because the goods sector which dominates trade is in a clear rebound while the services sector, the sector that dominates job growth domestically, has been slow to catch on. To make the various national recoveries durable, services industries have to catch on and job growth must get into gear.
| French Trade trends for goods, Excl Miliarty Equip | |||||
|---|---|---|---|---|---|
| m/m% | % Saar | ||||
| Jan-10 | Dec-09 | 3M | 6M | 12M | |
| Balance* | -€ 4,863.00 | -€ 5,346.00 | -€ 5,472.67 | -€ 4,983.00 | -€ 4,756.25 |
| Exports | |||||
| All Exp | 2.7% | 0.4% | 19.5% | -3.4% | 7.6% |
| Food, Bev &Tobacco | -2.6% | 0.8% | 14.5% | -4.4% | 0.5% |
| Transport Equip | 8.4% | 6.2% | 16.2% | -8.7% | 26.6% |
| Other Exp | 1.7% | -1.2% | 21.3% | -1.4% | 3.5% |
| IMPORTS | |||||
| All IMP | 0.9% | -2.1% | 13.9% | 11.1% | 3.6% |
| Food, Bev &Tobacco | 0.5% | -0.2% | 7.8% | -4.7% | -2.8% |
| Transport Equip | 0.1% | -0.9% | 12.0% | 13.1% | 11.5% |
| Other Imp | 1.1% | -2.5% | 14.8% | 12.3% | 2.6% |
| All data seasonally adjusted *Eur mlns; mo or period average | |||||
by Louise Curley March 9, 2010
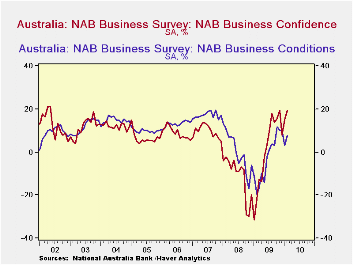
The National Australia Bank (not to be confused with the Reserve Bank of Australia, the central bank) publishes monthly indicators of business confidence and current conditions in business together with the data on business opinions of trading conditions, profitability, employment, forward orders, inventories, labor costs, purchases cost, prices, capacity utilization and exports.
Business confidence rose to a percent balance of 19.4% in February from 15.0% in January. It has recovered from the dip in December and is now close to the peak levels of the past as can be seen in the attached chart. The loss of confidence in December may have been due, in part, to the three 25 basis points rises in the central bank's policy rate that took place in October, November and December. Apparently, the business community has come to realize that increases in the cash rate are appropriate given the pace of Australian economic activity. A fourth rise 25 basis points to 4.0% in the cash rate took place on March 2 did not weaken confidence. The favorable balance of opinion about current conditions is up to 7.7% from 3.0% in January but it remains well below previous peaks.
The Australian economy is benefitting from the rise in activity among the emerging countries of the pacific region. China is now the single, largest recipient of Australia's exports. Ten years ago in 1999, China accounted for 4.7% of Australia's exports; in 2009 it accounted for 21.6% .
| Feb 10 | Jan 10 | Dec 09 | Nov 08 | Oct 09 | Sep 09 | Aug 09 | Jul 09 | |
|---|---|---|---|---|---|---|---|---|
| Business Confidence (% balance) | 19.4 | 15.0 | 7.9 | 19.2 | 15.8 | 13.7 | 18.1 | 9.7 |
| Business Conditions (% balance) | 7.7 | 3.0 | 10.1 | 10.3 | 11.8 | 3.2 | 3.8 | 1.0 |
by Tom Moeller March 09, 2010
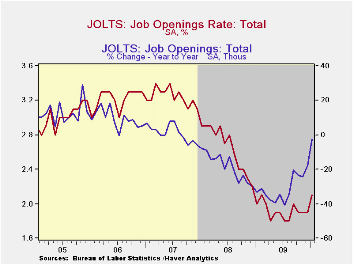 The
Bureau
of Labor Statistics indicated improvement in January's job market
conditions. The latest Job Openings & Labor Turnover Survey
(JOLTS) showed that the January job openings rate improved
to 2.1% which was the highest level since last February. The
job openings rate is the number of job openings on the last business
day of the month as a percent of total employment plus job openings. Job
availability doubled its December gain with a 7.6% increase and
remained off just 2.4% year-to-year. The latest figures reflect
benchmark revisions and the series dates back to December
2000.
The service sector led the improvement last month. Educational & health service jobs rose 13.2% (-0.5% y/y) and leisure & hospitality jobs increased 11.0% (7.2 y/y). Also, the number of professional & business service openings rose 6.9% (-15.0% y/y. Deterioration in the factory sector reversed the December gain with a 10.5% decline but openings were up by one-third from last year. Construction sector job openings also fell sharply for the third month in the last four +81.8% y/y.
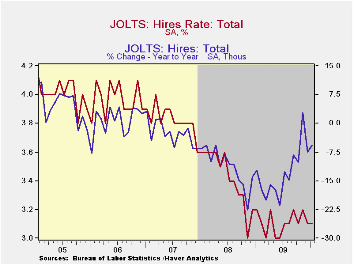
The hires rate has been stable near 3.1% since the end of 2008. The hires rate is the number of hires during the month divided by employment. The actual number of hires reversed half of the December decline with a 2.1% m/m increase (-5.8% y/y). Professional & business service sector hires recouped most of the December decline with a 13.7% increase (+2.1% y/y) while leisure & hospitality hires gained 8.2% (-1.9% y/y). Factory sector hiring increased 3.3% (18.4% y/y) but construction sector hiring fell 2.7% (-8.9% y/y).
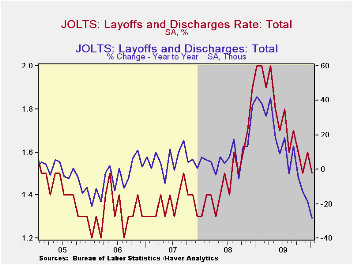
The job separations rate was stable at the series' low of 3.2% where it's been since August with the actual number of separations off 19.5% year-to-year. The layoff rate alone fell to a fifteen-month low of 1.5%. Separations include quits, layoffs, discharges, and other separations as well as retirements. The layoff rate alone ticked up to 1.6% but was down sharply from the January high of 1.9%.
The JOLTS survey dates only to December 2000 but has followed the movement in nonfarm payrolls, though the actual correlation between the two series is low
A description of the Jolts survey and the latest release from the U.S. Department of Labor is available here and the figures are available in Haver's USECON database.
| JOLTS (Job Openings & Labor Turnover Survey) | January | December | November | Jan. '09 | 2009 | 2008 | 2007 |
|---|---|---|---|---|---|---|---|
| Job Openings, Total | |||||||
| Rate (%) | 2.1 | 1.9 | 1.9 | 2.0 | 1.9 | 2.2 | 3.1 |
| Total (000s) | 2,724 | 2,531 | 2,456 | 2,792 | 2,531 | 3,078 | 4,378 |
| Hires, Total | |||||||
| Rate (%) | 3.1 | 3.1 | 3.2 | 3.2 | 37.3 | 41.1 | 45.9 |
| Total (000s) | 4,080 | 3,997 | 4,160 | 4,330 | 48,649 | 56,082 | 63,234 |
| Layoffs & Discharges, Total | |||||||
| Rate (%) | 1.5 | 1.6 | 1.5 | 1.7 | 20.7 | 17.7 | 16.5 |
| Total (000s) | 1,890 | 2,049 | 1,973 | 2,641 | 27,683 | 24,589 | 22,606 |
Tom Moeller
AuthorMore in Author Profile »Prior to joining Haver Analytics in 2000, Mr. Moeller worked as the Economist at Chancellor Capital Management from 1985 to 1999. There, he developed comprehensive economic forecasts and interpreted economic data for equity and fixed income portfolio managers. Also at Chancellor, Mr. Moeller worked as an equity analyst and was responsible for researching and rating companies in the economically sensitive automobile and housing industries for investment in Chancellor’s equity portfolio. Prior to joining Chancellor, Mr. Moeller was an Economist at Citibank from 1979 to 1984. He also analyzed pricing behavior in the metals industry for the Council on Wage and Price Stability in Washington, D.C. In 1999, Mr. Moeller received the award for most accurate forecast from the Forecasters' Club of New York. From 1990 to 1992 he was President of the New York Association for Business Economists. Mr. Moeller earned an M.B.A. in Finance from Fordham University, where he graduated in 1987. He holds a Bachelor of Arts in Economics from George Washington University.
More Economy in Brief
 Global| Feb 05 2026
Charts of the Week: Balanced Policy, Resilient Data and AI Narratives
by:Andrew Cates


