 Global| Dec 09 2008
U.S. Small Business Optimism Roughly Steady at 1975 Low
by:Tom Moeller
|in:Economy in Brief
Summary
According to the National Federation of Independent Business (NFIB), small business optimism held roughly steady last month. At 87.8, the index rose 0.3% m/m from October after that month's 5.8% decline to the lowest level since [...]
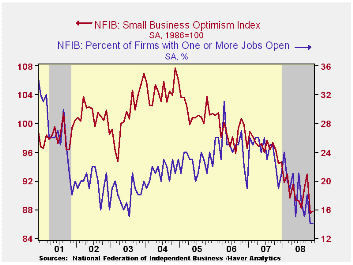
According to the National Federation of Independent Business (NFIB), small business optimism held roughly steady last month. At 87.8, the index rose 0.3% m/m from October after that month's 5.8% decline to the lowest level since early-1975.
During the last ten years there has been a 50% correlation between the level of the NFIB index and the two-quarter change in real GDP.
The percentage expecting the economy to improve rose very slightly after a large October decline. The percentage reporting that now is a good time to expand the business also rose slightly but remained near the lowest since 1982. During the next 3-6 months, plans for capital spending ticked up from October but was near the lowest level since 1975.
The percentage planning to raise employment fell into negative
territory while the percentage of respondents with one or more job
openings remained at 14%, the least since 1992. During the last ten
years there has been a 71% correlation between the NFIB employment
percentage and the y/y change in nonfarm payrolls.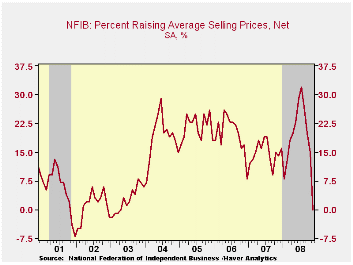
The percent expecting credit conditions to ease ticked up slightly but remained near its lowest level since 1980. The percent expecting higher real sales in six months also remained near its lowest since 1980.
The largest, single most important problems seen by business were poor sales (25%), taxes (21%), inflation (9%), insurance cost and availability (9%).
The percentage of firms actually raising prices fell to zero, the lowest since early 2002. During the last ten years there has been a 69% correlation between the y/y change in the producer price index and the level of the NFIB price index. The percentage of firms planning to raise prices also fell further to 11% which was the least since 2001.
About 24 million businesses exist in the United States. Small business creates 80% of all new jobs in America.
The NFIB figures can be found in Haver's SURVEYS database.
Restoring Financial Intermediation by Banks: The Role of Regulators is yesterday's speech by Fed Vice Chairman Donald L. Kohn and it it is available here.
| Nat'l Federation of Independent Business | November | October | Y/Y | 2007 | 2006 | 2005 |
|---|---|---|---|---|---|---|
| Small Business Optimism Index (1986=100) | 87.8 | 87.5 | -7.0% | 96.7 | 98.9 | 101.6 |
by Tom Moeller December 9, 2008
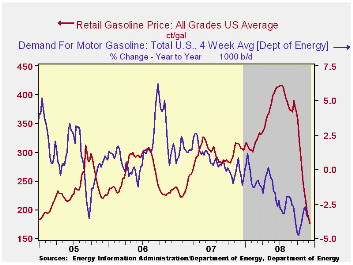
The pump price for a gallon of regular gasoline fell last week to $1.70, the lowest level since early 2005 according to the U.S. Department of Energy survey. The latest price was down eleven cents per gallon from the prior week and that was down by more than half since the peak early this past July. The latest decline was accompanied by a drop in the average price for all grades of gasoline to $1.76 per gallon.
Yesterday, the spot market price for a gallon of regular gasoline was up slightly from Friday's level but the six cent rise to $92 cents per gallon recouped just roughly half of Friday's decline. Last week spot prices averaged $1.02 per gallon.
Weekly gasoline prices can be found in Haver's WEEKLY database. Daily prices are in the DAILY database.
The U.S. Department of Energy reported that the demand
for gasoline fell by 3.5% y/y. The rate of decline has
bottomed out recently but the decline is still the fastest since
late-1995 (the latest four weeks versus the same four weeks last year).
The demand for all petroleum products also fell
6.2% y/y.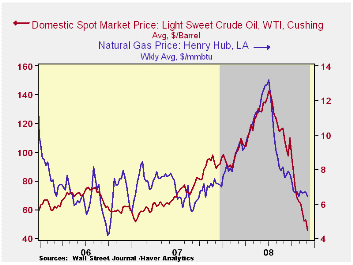
These DOE figures are available in Haver's OILWKLY database.
The price for a barrel of West Texas Intermediate crude oil last week fell by roughly seven dollars from last week's average to $45.50 per barrel, down by two-thirds since the peak in July of $145.66. In futures trading yesterday, the two-month price for crude oil stood at $46.36.
Last week, prices for natural gas fell to $6.44 per mmbtu (-10.1% y/y). The latest average price was nearly one-half below the high for natural gas prices in early-July of $13.19/mmbtu.
Assessing the Potential for Instability in Financial Market is yesterday's speech by Fed Governor Randall S. Kroszner and it can be found here.| Weekly Prices | 12/08/08 | 12/01/08 | Y/Y | 2007 | 2006 | 2005 |
|---|---|---|---|---|---|---|
| Retail Regular Gasoline ($ per Gallon) | 1.70 | 1.81 | -43.4% | 2.80 | 2.57 | 2.27 |
| Light Sweet Crude Oil, WTI ($ per bbl.) | 45.50 | 52.50 | -48.7% | 72.25 | 66.12 | 56.60 |
by Tom Moeller December 9, 2008
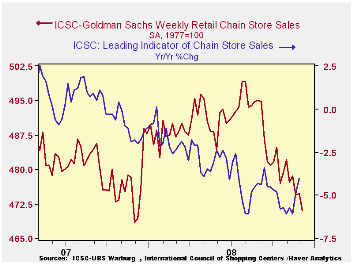
Chain store sales last week fell 0.8% after the 0.1% uptick during Thanksgiving week, according to the International Council of Shopping Centers-Goldman Sachs Index. The level of sales during the latest week was the lowest since December of last year and it was down 1.1% from the November average.
During the last ten years there has been a 59% correlation between the y/y change in chain store sales and the change in nonauto retail sales less gasoline.The ICSC-Goldman Sachs retail chain-store sales index is constructed using the same-store sales (stores open for one year) reported by 78 stores of seven retailers: Dayton Hudson, Federated, Kmart, May, J.C. Penney, Sears and Wal-Mart.
The weekly leading indicator of chain store sales from ICSC-Goldman Sachs jumped another 1.5% after a 0.9% rise during the prior week. The indicator remained down 4.0% from the year-ago level and it was near it's lowest level since 1996.
The chain store sales figures are available in Haver's SURVEYW database.
Some Principles to Consider in Future Regulatory Reform from Eric S. Rosengren, President & Chief Executive Officer of the Federal Reserve Bank of Boston and it can be found here.
| ICSC-UBS (SA, 1977=100) | 12/06/08 | 11/29/08 | Y/Y | 2007 | 2006 | 2005 |
|---|---|---|---|---|---|---|
| Total Weekly Chain Store Sales | 471.0 | 474.7 | 0.4% | 2.8% | 3.3% | 3.6% |
by Louise Curley December 9, 2008
The ZEW Center for European Economic Research in Mannheim, Germany released the results of its December survey today. In spite of an increase of 8.3 percentage points in the balance of opinion of German investors and analystsregarding the macroeconomic outlook, they are still about as pessimistic as they ever have been. The recent decline in sentiment began in mid 2007 with the spreading effects of the United States housing crisis and reached a low in July of this year when the excess of pessimists over optimists reached 63.9%. The only other period when pessimists exceeded optimists for a prolonged period took place in 1992 and early 1993. At that time, the excess of pessimists reached a peak of 62.2% in December1993 as shown in the attached chart, which shows the history of the ZEW indicators.
The reduction in the key interest rate of the European Central Bank, which now stands at 2.5%, down from 5.25% in September and the recent passage of a 32 billion euro stimulus plan by the German government may have helped to arrest the downward trend in pessimism regarding the outlook and to lead to the modest improvement in sentiment.
In contrast to the improvement in sentiment regarding the outlook, investors and analysts became more pessimistic in December about current conditions . The excess of pessimists over optimists regarding current condition now stands at 64.5%, up from 50.4% in November and not far from the high negatives of 1993 and 2003, as can be seen in the attached chart. While the fiscal and monetary measures undertaken in recent weeks may have improved sentiment concerning the outlook, there have been few, if any, encouraging developments in the real economy.
| GERMANY | Dec 08 | Nov 08 | Dec 07 | M/M chg | Y/Y chg | 2007 | 2006 | 2005 |
|---|---|---|---|---|---|---|---|---|
| ZEW INDICATOR (% BALANCE) | - | - | - | - | - | - | - | - |
| Current Situation | -64.5 | -50.4 | 63.5 | -14.1 | -128.0 | 7.3 | 75.9 | 18.3 |
| Future Conditions | -45.2 | -53.5 | -37.2 | 8.3 | -8.0 | -47.5 | -3.0 | 22.3 |

Tom Moeller
AuthorMore in Author Profile »Prior to joining Haver Analytics in 2000, Mr. Moeller worked as the Economist at Chancellor Capital Management from 1985 to 1999. There, he developed comprehensive economic forecasts and interpreted economic data for equity and fixed income portfolio managers. Also at Chancellor, Mr. Moeller worked as an equity analyst and was responsible for researching and rating companies in the economically sensitive automobile and housing industries for investment in Chancellor’s equity portfolio. Prior to joining Chancellor, Mr. Moeller was an Economist at Citibank from 1979 to 1984. He also analyzed pricing behavior in the metals industry for the Council on Wage and Price Stability in Washington, D.C. In 1999, Mr. Moeller received the award for most accurate forecast from the Forecasters' Club of New York. From 1990 to 1992 he was President of the New York Association for Business Economists. Mr. Moeller earned an M.B.A. in Finance from Fordham University, where he graduated in 1987. He holds a Bachelor of Arts in Economics from George Washington University.
More Economy in Brief


