 Global| Sep 09 2008
U.S. Small Business Optimism Recovered
by:Tom Moeller
|in:Economy in Brief
Summary
Small business optimism, according to the National Federation of Independent Business (NFIB), recovered last month to the highest level since April. The 3.3% m/m rise to 91.1 made up all of a 1.1% July decline which had pulled the [...]
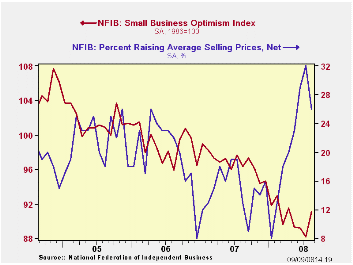
Small business optimism, according to the National Federation of Independent Business (NFIB), recovered last month to the highest level since April. The 3.3% m/m rise to 91.1 made up all of a 1.1% July decline which had pulled the index to its lowest level since early 1975.
During the last ten years there has been a 70% correlation between the level of the NFIB index and the two quarter change in real GDP.
The percentage planning to raise employment recovered modestly to 9% which was the highest level since February. Nevertheless, the percentage of respondents with one or more job openings fell back to the recent five-year low. During the last ten years there has been a 71% correlation between the NFIB employment percentage and the y/y change in nonfarm payrolls.
The percent expecting the economy to improve rose to the
highest level since late 2006. As a result, only six percent of
respondents thought that now was a good time to expand the business,
the least since 1982.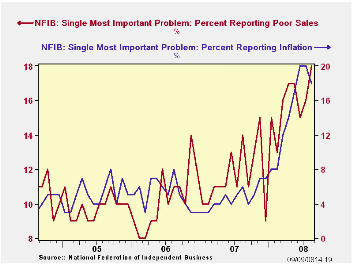
The percentage of firms actually raising prices fell back to 26% from 32% in July which was the highest level since 1981. During the last ten years there has been a 64% correlation between the y/y change in the producer price index and the level of the NFIB price index. The percentage of firms planning to raise prices also fell back to 30% which was the least since March.
The largest, single most important problems seen by business were poor sales (18%), inflation (18%), insurance cost and availability (13%) and taxes (17%). The latter, however, was much reduced from 27% in early 2007.
About 24 million businesses exist in the United States. Small business creates 80% of all new jobs in America.
The NFIB figures can be found in Haver's SURVEYS database.
The statement by Federal Reserve Board Chairman Ben S. Bernanke on Fannie Mae and Freddie Mac can be found here.
| Nat'l Federation of Independent Business | August | July | Y/Y | 2007 | 2006 | 2005 |
|---|---|---|---|---|---|---|
| Small Business Optimism Index (1986=100) | 91.1 | 88.2 | -5.4% | 96.7 | 98.9 | 101.6 |
by Tom Moeller September 9, 2008
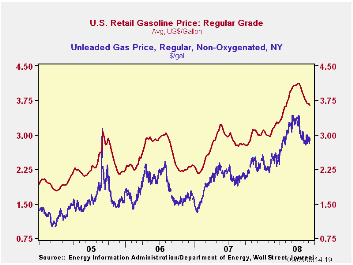
The pump price for a gallon of regular gasoline fell three cents last week to $3.65 after having been roughly unchanged during the week prior, according to the U.S. Department of Energy survey. The price has fallen by 47 cents, or more than ten percent from the peak in early July but the rate of decline has slowed. For all grades of gasoline the average price fell last week by two cents to $3.72 per gallon.
Yesterday the spot market price for a gallon of regular
gasoline rose by ten cents from Friday's level to $2.92 per gallon as
the storm threat passed. Since early-August these prices have moved
erratically sideways.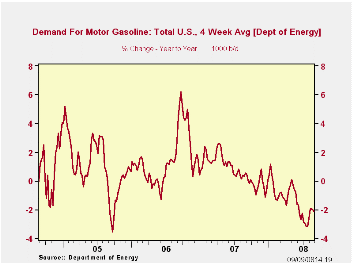
Weekly gasoline prices can be found in Haver's WEEKLY database, daily prices are in the DAILY database.
According to the U.S. Department of Energy, the demand for gasoline fell a slight 0.2% during the last four weeks and it was down 2.2% from a year earlier.
The DOE figures are available in Haver's OILWKLY database.
The price for a barrel of West Texas Intermediate crude oil fell last week to an average $108.42 per barrel. That's down from the high early last month of $142.46. Yesterday, crude oil prices were down another two dollars from last week's average.
Prices for natural gas fell w/w to an average $7.53 per mmbtu
(+32.9% y/y) which was its lowest level this year. The high for natural
gas prices was in early-July at $13.19/mmbtu.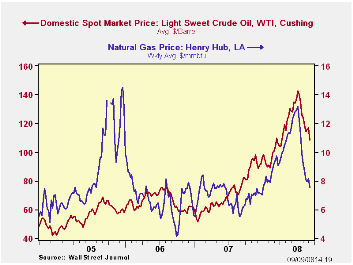
How Economic News Moves Markets from the Federal Reserve Bank of New York can be found here.
The U.S. Economic Situation and the Challenges for Monetary Policy is a recent speech by San Francisco Fed President Janet L. Yellen and it can be found here.
| Weekly Prices | 09/08/08 | 09/01/08 | Y/Y | 2007 | 2006 | 2005 |
|---|---|---|---|---|---|---|
| Retail Regular Gasoline ($ per Gallon) | 3.65 | 3.68 | 29.5% | 2.80 | 2.57 | 2.27 |
| Light Sweet Crude Oil, WTI ($ per bbl.) | 108.42 | 116.55 | 42.7% | 72.25 | 66.12 | 56.60 |
by Tom Moeller September 9, 2008
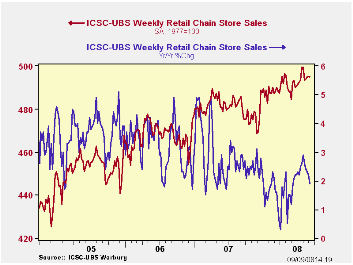
According to the International Council of Shopping Centers, chain store sales ticked down 0.1% last week and reversed the 0.1% uptick during the week prior. As a result, sales began this month 0.1% below the August average after that month's 0.2% uptick. Year-to-year growth in sales eased to 1.9% from the recent peak rate of growth of 2.9%.
During the last ten years there has been a 45% correlation between the y/y change in chain store sales and the change in nonauto retail sales less gasoline.
The ICSC-UBS retail chain-store sales index is constructed using the same-store sales (stores open for one year) reported by 78 stores of seven retailers: Dayton Hudson, Federated, Kmart, May, J.C. Penney, Sears and Wal-Mart.
The leading indicator of chain store sales from ICSC-UBS rose 0.8% (-4.2% y/y) to the highest level since mid-July.
The chain store sales figures are available in Haver's SURVEYW database.
Summer Reading: New Research in Applied Microeconomics Conference Summary from the Federal Reserve Bank of San Francisco is available here.
| ICSC-UBS (SA, 1977=100) | 09/06/08 | 08/29/08 | Y/Y | 2007 | 2006 | 2005 |
|---|---|---|---|---|---|---|
| Total Weekly Chain Store Sales | 494.7 | 495.1 | 1.9% | 2.8% | 3.3% | 3.6% |
by Tom Moeller September 9, 2008
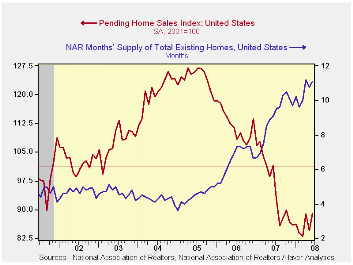
The National Association of Realtors reported that the July change in pending sales of existing homes reversed about half of the prior month's increase. The decline of 3.2% was larger than Consensus expectations for a 1.3% drop.
These figures are analogous to the new home sales data from the Commerce Department in that they measure existing home sales when the sales contract is signed, not at the time the sale is closed. The series dates back to 2001.
The regional sales figures indicated that lower sales in the West, -10.6% m/m, accounted for much of the July decline following improvement earlier this year. Sales in the North east also fell by 7.5% and that reversed the improvement during the prior four months. Sales in the Midwest rose 2.8% but have moved sideways so far this year. Sales in the South remained unchanged versus June but year-to-date have shown some improvement.
The Realtors association indicated in an earlier report that the number of homes on the market & available for sale rose a not seasonally adjusted 3.9% (2.4% y/y) after a 0.3% uptick during June.
At the current sales rate there was an 11.2 months' supply of homes on the market versus an 8.9 months' average during all of last year, a 6.5 months' supply in 2006 and a 4.5 months' supply in 2005.
The median sales price of an existing single family home fell 1.3% (-7.7% y/y) during July and prices were down 8.0% from their peak in June of last year.
The pending home sales data are available in Haver's PREALTOR database and the number of homes on the market are in the REALTOR database.
| Pending Home Sales (2001=100) | July | June | Y/Y | 2007 | 2006 | 2005 |
|---|---|---|---|---|---|---|
| Total | 86.5 | 89.4 | -6.8% | 95.7 | 112.1 | 124.3 |
| Northeast | 73.6 | 79.6 | -13.2 | 85.6 | 98.5 | 108.3 |
| Midwest | 81.6 | 79.4 | -2.4 | 89.6 | 102.0 | 116.4 |
| South | 93.7 | 93.7 | -13.3 | 107.3 | 127.3 | 134.8 |
| West | 90.3 | 101.0 | 6.5 | 92.1 | 109.5 | 128.6 |
by Tom Moeller September 9, 2008
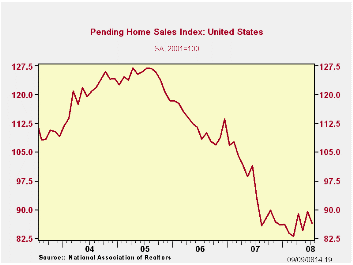
The National Association of Realtors reported that the July change in pending sales of existing homes reversed about half of the prior month's increase. The decline of 3.2% was larger than Consensus expectations for a 1.3% drop.
These figures are analogous to the new home sales data from the Commerce Department in that they measure existing home sales when the sales contract is signed, not at the time the sale is closed. The series dates back to 2001.
The regional sales figures indicated that lower sales in the
West, -10.6% m/m, accounted for much of the July decline following
improvement earlier this year. Sales in the North east also fell by
7.5% and that reversed the improvement during the prior four months.
Sales in the Midwest rose 2.8% but have moved sideways so far this
year. Sales in the South remained unchanged versus June but
year-to-date have shown some improvement.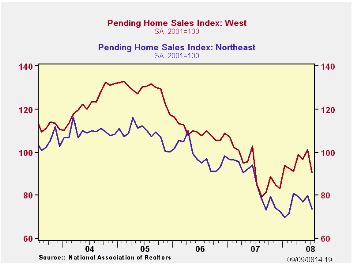
The Realtors association indicated in an earlier report that the number of homes on the market & available for sale rose a not seasonally adjusted 3.9% (2.4% y/y) after a 0.3% uptick during June.
At the current sales rate there was an 11.2 months' supply of homes on the market versus an 8.9 months' average during all of last year, a 6.5 months' supply in 2006 and a 4.5 months' supply in 2005.
The median sales price of an existing single family home fell 1.3% (-7.7% y/y) during July and prices were down 8.0% from their peak in June of last year.
The pending home sales data are available in Haver's PREALTOR database and the number of homes on the market are in the REALTOR database.
| Pending Home Sales (2001=100) | July | June | Y/Y | 2007 | 2006 | 2005 |
|---|---|---|---|---|---|---|
| Total | 86.5 | 89.4 | -6.8% | 95.7 | 112.1 | 124.3 |
| Northeast | 73.6 | 79.6 | -13.2 | 85.6 | 98.5 | 108.3 |
| Midwest | 81.6 | 79.4 | -2.4 | 89.6 | 102.0 | 116.4 |
| South | 93.7 | 93.7 | -13.3 | 107.3 | 127.3 | 134.8 |
| West | 90.3 | 101.0 | 6.5 | 92.1 | 109.5 | 128.6 |
by Louise Curley September 9, 2008
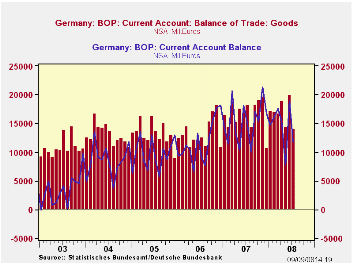
Germany's seasonally unadjusted current account fell 7.1 billion euros in July from June and 3.4 billion euros from July, 2007. In the GERMANY database, the monthly data on the current account are available only in seasonally unadjusted terms. In the G10 data base, however, the current account has been seasonally adjusted by Haver Analytics. On the seasonally adjusted basis the monthly decline in the current account was much smaller--3.0 billion euros.
Germany's balance on trade in goods is the largest component of its current account balance as can be seen in the first chart that compares the current account balance with the balance on trade in goods (both on an unadjusted basis). Frequently the surplus on trade in goods is larger than the current account surplus. The monthly balance on trade in goods and in exports and imports are available on both a seasonally adjusted and unadjusted basis in the GERMANY and G10 databases.
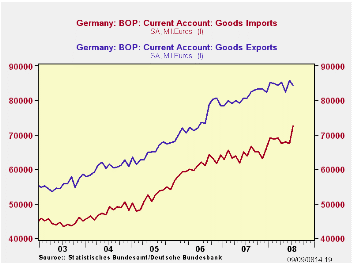
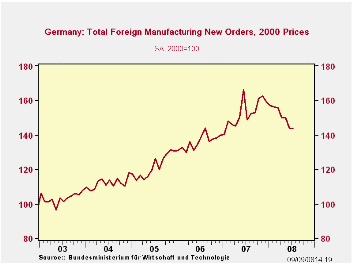
The balance on the seasonally adjusted trade in goods declined by 6.5 billion euros from 18.2 billion euro in June to 11.8 billion euro in July. Exports declined by 1.4 billion euros, and imports increased by 5.0 billion euros. Exports and imports are shown in the second chart. The data on the commodity classification of exports and imports and the origin of imports and destination of exports are not yet available. The decline in exports is easier to explain than the rise in imports. Foreign manufacturing orders (shown in the third chart) have been declining since late last year, presaging a decline in exports. Declining oil prices and lower economic activity, however, would seem to suggest lower, not higher imports. The explanation of the rise in imports will be apparent when the more complete balance of payments data become available some time next week.
| GERMANY | Jul 08 | Jun 08 | Jul 07 | M/M Dif | Y/Y Dif | 2007 | 2006 | 2005 |
|---|---|---|---|---|---|---|---|---|
| Current Account (NSA, Bil. Euro) | 11.8 | 18.9 | 15.2 | -7.1 | -3.4 | 184.0 | 141.5 | 116.6 |
| Trade in Good Balance (NSA, Bil. Euro) | 13.9 | 19.9 | 18.1 | -6.0 | -4.2 | 198.6 | 159.1 | 158.2 |
| Exports (NSA, Bil. Euro) | 87.1 | 88.3 | 81.2 | -1.2 | 5.8 | 969.0 | 893.0 | 786.2 |
| Imports (NSA, Bil. Euro) | 73.2 | 68.4 | 63.2 | 4.8 | 10.0 | 770.3 | 734.0 | 628.1 |
| Current Account (SA by Haver, Bil. Euro) | 13.0 | 16.1 | 16.4 | -3.0 | -3.3 | -- | -- | -- |
| Trade in Goods Balance (SA, Bil. Euro) | 11.8 | 18.2 | 16.7 | -6.5 | -4.9 | -- | -- | -- |
| Exports (SA, Bil. Euro) | 84.4 | 85.8 | 80.6 | -1.4 | 3.8 | -- | -- | -- |
| Imports (SA, Bil. Euro) | 42.6 | 67.6 | 63.9 | 5.0 | 8.7 | -- | -- | -- |
by Robert Brusca September 9, 2008
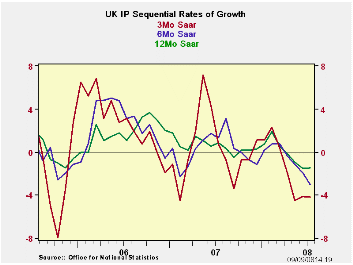
UK industrial output weakness is hardly a surprise after the sharp break posted by the UK’s July PPI. Clearly, weakness is at work and it is having an impact on prices due to its severity. Manufacturing output continues to decline over 12 months; its rate of descent accelerates over ever shorter time spans. All major MFG output groups are showing declines even year-over-year. Consumer durables are off by 5.1%. Nondurables are off by 0.8%. Intermediate goods output is off by 2.4% and capital goods output is off by 1.4%. In addition each category is showing growth rates that are progressively weaker in pace from twelve months to six months to three months. The UK slowdown is quite broad-based and quite entrenched. Its progress in Q3 already points to a decline in the quarter that is well underway.
| UK IP and MFG | ||||||||||
|---|---|---|---|---|---|---|---|---|---|---|
| Saar except m/m | Mo/Mo | Jul 08 |
Jun 08 |
Jul 08 |
Jun 08 |
Jul 08 |
Jun 08 |
|||
| UK MFG | Jul 08 |
Jun 08 |
May 08 |
3Mo | 3Mo | 6mo | 6mo | 12mo | 12mo | Q3 Date |
| MFG | -0.2% | -0.5% | -0.4% | -4.1% | -4.1% | -3.0% | -1.9% | -1.4% | -1.5% | -3.8% |
| Consumer | ||||||||||
| C-Durables | -1.6% | -0.3% | -0.9% | -10.9% | -5.9% | -6.0% | -2.8% | -5.1% | -4.3% | -12.1% |
| C-Nondurables | 0.2% | -0.4% | -0.8% | -3.9% | -5.9% | -3.0% | -3.0% | -0.8% | -1.2% | -2.0% |
| Intermediate | -0.9% | 0.5% | -0.8% | -4.9% | -0.8% | -2.7% | -2.1% | -2.4% | -1.4% | -5.1% |
| Capital | 0.0% | -1.0% | -0.4% | -5.3% | -4.3% | -3.2% | -3.7% | -1.4% | -2.4% | -4.6% |
| Memo: Detail | 1Mo% | 1Mo% | 1Mo% | 3Mo | 3Mo | 6mo | 6mo | 12mo | 12mo | Q3 Date |
| Food Drink & Tobacco |
-0.2% | -0.9% | -1.0% | -8.0% | -10.2% | -6.0% | -4.9% | -2.9% | -2.6% | -6.6% |
| Textile & Leather | 0.9% | 0.1% | 0.8% | 7.6% | 0.0% | 4.9% | 3.8% | 1.5% | -0.1% | 7.8% |
| Motor Vehicles & Trailer |
2.1% | -1.0% | -3.9% | -11.2% | -12.4% | -2.1% | -2.3% | 0.4% | -1.6% | 0.2% |
| Mining and Quarry | -3.7% | 0.3% | 0.7% | -10.6% | 2.2% | -7.8% | -8.5% | -9.3% | -4.5% | -18.3% |
| Electricity, Gas & H2O |
1.0% | 2.1% | -4.2% | -4.9% | -2.3% | 2.2% | -4.4% | 1.6% | -1.0% | 5.6% |

Tom Moeller
AuthorMore in Author Profile »Prior to joining Haver Analytics in 2000, Mr. Moeller worked as the Economist at Chancellor Capital Management from 1985 to 1999. There, he developed comprehensive economic forecasts and interpreted economic data for equity and fixed income portfolio managers. Also at Chancellor, Mr. Moeller worked as an equity analyst and was responsible for researching and rating companies in the economically sensitive automobile and housing industries for investment in Chancellor’s equity portfolio. Prior to joining Chancellor, Mr. Moeller was an Economist at Citibank from 1979 to 1984. He also analyzed pricing behavior in the metals industry for the Council on Wage and Price Stability in Washington, D.C. In 1999, Mr. Moeller received the award for most accurate forecast from the Forecasters' Club of New York. From 1990 to 1992 he was President of the New York Association for Business Economists. Mr. Moeller earned an M.B.A. in Finance from Fordham University, where he graduated in 1987. He holds a Bachelor of Arts in Economics from George Washington University.
More Economy in Brief


