 Global| Mar 10 2009
U.S. Small Business Optimism Nearing All-time Low
by:Tom Moeller
|in:Economy in Brief
Summary
According to the National Federation of Independent Business (NFIB), small business optimism fell even further last month. The index level of 82.6 was down 1.8% month-to-month after a slightly revised 1.3% January decline. The latest [...]
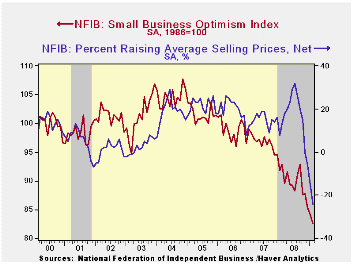
According to the National Federation of Independent Business (NFIB), small business optimism fell even further last month. The index level of 82.6 was down 1.8% month-to-month after a slightly revised 1.3% January decline. The latest level was 8.0% below the 2008 average and it was the second lowest level on record.
During the last ten years there has been a 49% correlation between the level of the NFIB index and the two-quarter change in real GDP.
The percentage of firms planning
to raise prices dropped to 1%, a new record low. Price
discounts were evident as the percentage of firms actually
raising prices fell further into negative territory, and the reading
was a record low. During the last ten years there has been a
69% correlation between the y/y change in the producer price index and
the level of the NFIB price index.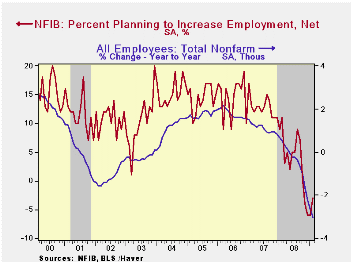
The percent expecting credit conditions to ease fell further and was near its lowest level since 1980. The percent expecting higher real sales in six months fell to a net negative 29%, a record low.
The percentage expecting the economy to improve fell further into negative territory. The percentage reporting that now is a good time to expand the business fell to 3% which was the second lowest reading on record. During the next 3-6 months, plans for capital spending fell slightly and was still near the lowest level since 1975.
The percentage planning to raise employment improved just slightly to a net negative 3% while the percentage of respondents with one or more job openings was stable at 11%, the least since 1992. During the last ten years there has been a 71% correlation between the NFIB employment percentage and the y/y change in nonfarm payrolls.
The largest, single most important problems seen by business were poor sales (33%), taxes (19%), government requirements (10%), insurance cost and availability (8%), competition from large businesses (6%) and inflation (6%).
About 24 million businesses exist in the United States. Small business creates 80% of all new jobs in America.
The NFIB figures can be found in Haver's SURVEYS
database.
Financial Reform to Address Systemic Risk is this morning's speech by Fed Chairman Ben S. Bernanke at the Council on Foreign Relations, Washington, D.C. It is available here.
| Nat'l Federation of Independent Business | February | January | Y/Y | 2008 | 2007 | 2006 |
|---|---|---|---|---|---|---|
| Small Business Optimism Index (SA, 1986=100) | 82.6 | 84.1 | -11.1% | 89.8 | 96.7 | 98.9 |
by Tom Moeller March 10, 2009
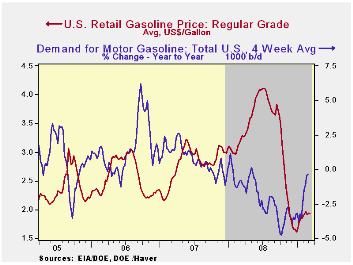
Regular gasoline prices were roughly stable last week, up one penny to $1.94 per gallon. That left the price still near the middle of the $1.89 to $1.96 range in place since early February but the latest was up 33 cents from the December low. Yesterday, the spot market price for regular gasoline was also about stable at $1.23. The figures are reported by the U.S. Department of Energy.
Weekly gasoline prices can be found in Haver's WEEKLY database. Daily prices are in the DAILY database.
Gasoline demand continued downward last
week, according to the U.S. Energy Department. The y/y change of -0.4%,
however, has moderated from the rate of decline seen last October when
demand was falling 4.8% y/y. (Gasoline prices at the time were just off
their peak.) The change in demand is measured using the latest four
weeks versus the same four weeks in 2008. Demand for all petroleum
products was down 1.3% year-to-year after the -8.0% comparison last
October. These numbers are available in Haver's OILWKLY database.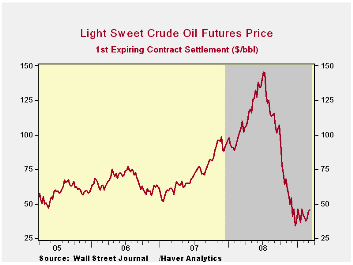
The price for a barrel of West Texas Intermediate crude oil rose last week to $43.26 per barrel. That pulled prices to the high end of their recent range between $37.00 and $44.50 per barrel. Prices reached a high of $145.66 last July. In futures trading yesterday, the one-month price for crude oil rose even further to $47.07 per barrel. Last week's average was $43.26 and the February low was $36.91.
Also reported by the U.S. Energy Information Agency was that inventories of crude oil & petroleum products rose 6.2% year-to-year after a 7.5% decumulation rate this past September. Distillate fuel oil inventories have risen by 21.8% year-to-year while gasoline inventories are off 8.0%. These demand & inventory figures also are available in Haver's OILWKLY database.
The price of natural gas ticked up last week to $4.24 per mmbtu (-55.2% y/y), near the lowest level since September 2006. The latest average price was down more than two-thirds from the high reached in early-July of $13.19/mmbtu.
| Weekly Prices | 03/09/09 | 03/02/09 | Y/Y | 2008 | 2007 | 2006 |
|---|---|---|---|---|---|---|
| Retail Regular Gasoline ($ per Gallon, Regular) | 1.94 | 1.93 | -39.8% | 3.25 | 2.80 | 2.57 |
| Light Sweet Crude Oil, WTI ($ per bbl.) | 43.26 | 41.81 | -58.2% | 100.16 | 72.25 | 66.12 |
by Tom Moeller March 10, 2009
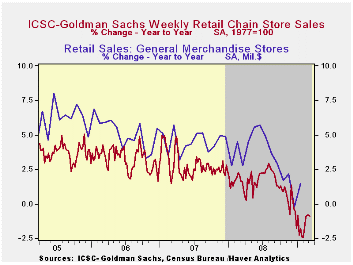
Chain store sales ticked up 0.2% last week and began this month slightly above the February average, according to the International Council of Shopping Centers-Goldman Sachs Index. A moderate rebound in consumer spending is indicated by the 3.0% increase in the level of spending from the late-January low.
The chain store sales figures are available in Haver's SURVEYW database.
During the last ten years there has been a 64% correlation between the year-to-year growth in chain store sales and the growth in general merchandise sales.
The ICSC-Goldman Sachs retail chain-store sales index is constructed using the same-store sales (stores open for one year) reported by 78 stores of seven retailers: Dayton Hudson, Federated, Kmart, May, J.C. Penney, Sears and Wal-Mart.
The outlook for sales, however, remains cautious. The weekly leading indicator of chain store sales from ICSC-Goldman Sachs slipped another 0.2% last week and for all of February fell 2.3% from January (-4.4% y/y).
Inflation Targeting—Central Bank Practice Overseas from the Federal Reserve Bank of Boston can be found here.
| ICSC-UBS (SA, 1977=100) | 03/07/09 | 02/28/09 | Y/Y | 2008 | 2007 | 2006 |
|---|---|---|---|---|---|---|
| Total Weekly Chain Store Sales | 484.1 | 483.0 | -0.9% | 1.4% | 2.8% | 3.3% |
Foreign Trade in France andGermany: Casualties of the Recession
by Louise Curley March 10, 2009
 Country after country has
been reporting declines in its
foreign trade. Imports are down as a result of falling incomes at home,
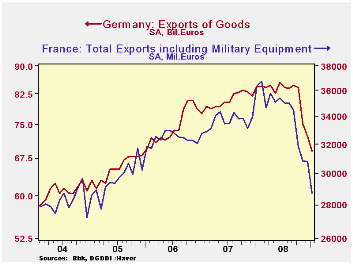
and exports are down as a result of falling incomes abroad. Today
France reported a 6.7% decline in exports in January from December
while Germany reported a 4.4% decline. From January 2008 to January
2009, French exports declined 21% while those in Germany declined
18.4%.
Country after country has
been reporting declines in its
foreign trade. Imports are down as a result of falling incomes at home,
and exports are down as a result of falling incomes abroad. Today
France reported a 6.7% decline in exports in January from December
while Germany reported a 4.4% decline. From January 2008 to January
2009, French exports declined 21% while those in Germany declined
18.4%. 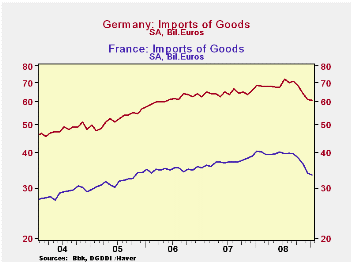 Imports in France were down17.6% in January from a year ago and
imports in Germany were down 11.1% over the same period. Exports from
France and Germany are shown in the first chart and imports into France
and Germany are shown in the second chart.
Imports in France were down17.6% in January from a year ago and
imports in Germany were down 11.1% over the same period. Exports from
France and Germany are shown in the first chart and imports into France
and Germany are shown in the second chart.
Germany typically runs a substantial trade surplus. It reached
a peak of 19.34 billion euros in November 2007. With exports declining
at a faster rate than imports, the balance on trade in goods has
trended downward and in January, 2009 was only 8.3 billion euros.
France, on the other hand has been running a growing trade deficit
since early 2004. 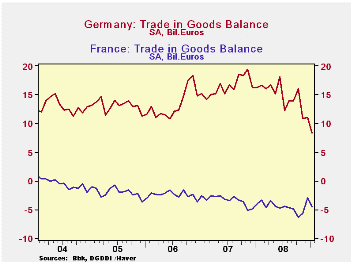 The deficit improved in December to minus 2.95
billion euro from minus 5.67 billion in November but has worsened again
in January and is now at minus 4.55 billion euros. The balances on
trade in goods for France and Germany are shown in the third chart.
The deficit improved in December to minus 2.95
billion euro from minus 5.67 billion in November but has worsened again
in January and is now at minus 4.55 billion euros. The balances on
trade in goods for France and Germany are shown in the third chart.
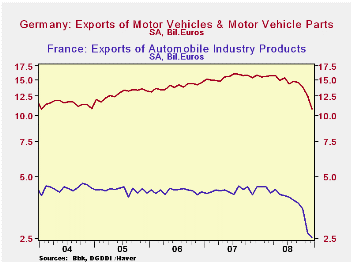 Automobiles and related products have been responsible for a
good part of the decline in exports in France and Germany. The fourth
chart shows exports of these products. The data only go through
December, but even by then the exports of these products were down
31.6% in Germany from a year ago and 44.4% in France. The fourth chart
shows these exports for France and Germany.
Automobiles and related products have been responsible for a
good part of the decline in exports in France and Germany. The fourth
chart shows exports of these products. The data only go through
December, but even by then the exports of these products were down
31.6% in Germany from a year ago and 44.4% in France. The fourth chart
shows these exports for France and Germany.
| FOREIGN TRADE (Bil Euros) | Jan 09 | Dec 08 | Jan 08 | M/M CHG | Y/Y CHG | 2008 | 2007 |
|---|---|---|---|---|---|---|---|
| GERMANY | |||||||
| Exports | 68.95 | 72.13 | 84.25 | -4.41% | -18.35% | 990.18 | 968.36 |
| Imports | 60.64 | 61.11 | 68.23 | -0.77% | -11.12% | 813.46 | 771.96 |
| Balance | 8.31 | 11.02 | 16.22 | -2.71 | -7.91 | 176.7 | 196.40 |
| FRANCE | |||||||
| Exports (Bil Euros) | 28.74 | 30.80 | 36.37 | -6.70% | -20.99% | 412.00 | 403.12 |
| Imports | 33.28 | 33.75 | 40.38 | -1.38% | -17.57% | 465.40 | 443.07 |
| Balance | -4.55 | -2.95 | -4.01 | -1.59 | -0.54 | -53.4 | -39.95 |
by Robert Brusca March 10, 2009
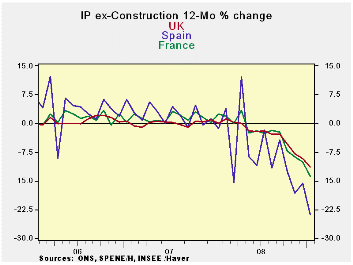
IP drops sharply – Record drop in France
Industrial production continues to show steep declines in the Zone.
France reported the largest decline to day since 1990 when the INSEE
series first began. Spain’s volatile index fell by 8.4% in January.
Italy’s index dropped by 2.8%. For these three countries of the EU,
three month declines in output range from an annual pace of -45% in
Spain to -26% in France. Over the past year Spain is off by 23% while
France and the UK see IP however by about 13%. Quarter-to-date in
January of 2009 IP is falling at an annual rate drop of greater than
20% in each of these countries and as much as -35% in Spain.
Europe is STILL in denial: What? Me worry?
Despite all this and despite new warnings of slower growth and a global
decline in growth from the IMF Europe seems distant. Trichet sounds
upbeat. Weber says there is no reason for the ECBs key lending rate to
go below 1%. Europe has spurned the US request for more stimulus. The
German’s have tuned a cold shoulder to France’s idea of cutting back
the VAT tax. Yet the EU commission, that bastion of fiscal
responsibility, is issuing a warning to Germany about excess spending.
Alfred E Newman meets Euroland: Europe is
not on the same page as the IMF, the World Bank, or the US. Economists
in the US are talking about the prospect of DEPRESSION. In Europe they
are ‘la tee da’ about the downturn treating it like a minor
inconvenience, not even as the powerful recession that it clearly is,
let alone acknowledging the risk of worsening. The EU Commission is
concerned about the Mass-Trick criterion for debt to GDP and about
annual fiscal deficits as if Europe were out of sorts with its fiscal
pledges in a boom year. A boom year it is not. Europe is in denial from
the EU Commission to the ECB itself.
The industrial output index is not out of touch. It is taking
noting lightly, it is taking it on the chin. And that raises some
issues for Europe if policy is not going to be responsive to its
clearly deteriorating situation.
| Main E-zone Countries and UK IP in MFG | |||||||
|---|---|---|---|---|---|---|---|
| Mo/Mo | 3-Mo | 6-mo | 12-mo | Jan-09 | |||
| MFG Only | Jan-09 | Dec-08 | Nov-08 | Jan-09 | Jan-09 | Jan-09 | Q-2-Date |
| France: IP excl Construction | -3.1% | -1.5% | -2.8% | -26.0% | -21.3% | -13.8% | -26.9% |
| Spain | -8.4% | 3.8% | -9.5% | -45.1% | -38.0% | -23.7% | -34.7% |
| UK | -2.8% | -1.9% | -3.0% | -26.8% | -19.9% | -12.8% | -23.2% |
| Mo/Mo are simple percent changes others are at SAARs | |||||||
by Tom Moeller March 10, 2009
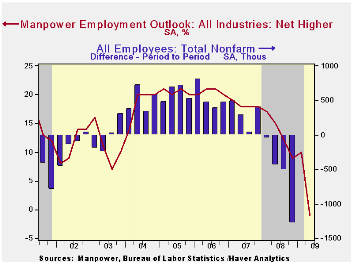
The latest survey of hiring intentions by 31,800 employers, performed by Manpower Inc., indicates the weakest plans since the "credit crunch" recession of 1980. The Manpower Index level of -1 for 2Q09 follows a string of steadily declining readings since the series' peak in 2005-06. These figures are seasonally adjusted.
During the last ten years there has been a 70% correlation between the level of the Manpower Index and the quarterly change in nonfarm payroll employment.Only the overall figure is seasonally adjusted while industry detail is not.
On a not seasonally adjusted basis, the 2Q level indicates that 15% of firms intend to raise employment and 14% expected to lower the number of jobs. No change in employment is expected by 67% of firms. This is up from an average 59% who expected no change from 2006 to 2008.
Plans for the second quarter in the manufacturing sector are quite weak with a net reading of -7. This reflects 13% of employers who expect to raise employment versus 20% who expect to decrease it. In the construction industries, 16% expect to increase hiring while 20% expect to cut. In financial businesses, 12% expect higher employment while 10% expect a lower number of jobs.
Weakness in hiring plans is evenly spread across the nation's regions.
The Manpower figures can be found in Haver's SURVEYS database.
| Manpower Inc Employment Outlook Surey | 2Q 09 | 1Q 09 | 2Q 08 | 2008 | 2007 | 2006 |
|---|---|---|---|---|---|---|
| Net Higher (SA, %) | -1 | 10 | 15 | 13 | 18 | 21 |

Tom Moeller
AuthorMore in Author Profile »Prior to joining Haver Analytics in 2000, Mr. Moeller worked as the Economist at Chancellor Capital Management from 1985 to 1999. There, he developed comprehensive economic forecasts and interpreted economic data for equity and fixed income portfolio managers. Also at Chancellor, Mr. Moeller worked as an equity analyst and was responsible for researching and rating companies in the economically sensitive automobile and housing industries for investment in Chancellor’s equity portfolio. Prior to joining Chancellor, Mr. Moeller was an Economist at Citibank from 1979 to 1984. He also analyzed pricing behavior in the metals industry for the Council on Wage and Price Stability in Washington, D.C. In 1999, Mr. Moeller received the award for most accurate forecast from the Forecasters' Club of New York. From 1990 to 1992 he was President of the New York Association for Business Economists. Mr. Moeller earned an M.B.A. in Finance from Fordham University, where he graduated in 1987. He holds a Bachelor of Arts in Economics from George Washington University.
More Economy in Brief


