 Global| Nov 11 2008
U.S. Small Business Optimism Lowest Since 1975
by:Tom Moeller
|in:Economy in Brief
Summary
According to the National Federation of Independent Business (NFIB), small business optimism collapsed last month. The 5.8% m/m decline to an index level of 87.5 reversed all of the gains during the prior two months and dropped the [...]
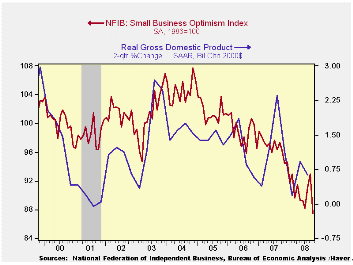
According to the National Federation of Independent Business (NFIB), small business optimism collapsed last month. The 5.8% m/m decline to an index level of 87.5 reversed all of the gains during the prior two months and dropped the level of optimism to its lowest level since early 1975.
During the last ten years there has been a 50% correlation between the level of the NFIB index and the two-quarter change in real GDP.
Plans for capital expenditures collapsed with the recent weakness if corporate profits. During the next 3-6 months, plans for spending fell to their lowest level since 1975.
The percent expecting credit conditions to ease fell to its
lowest level since 1980 while the percent expecting higher real sales
in six months dropped also to its lowest since 1980. Only five percent
of firms thought that now was a good time to expend the business, near
the lowest since 1982.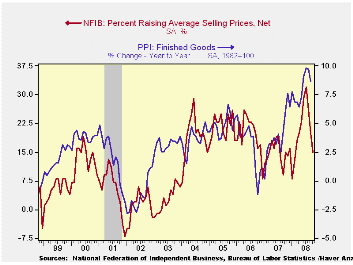
The percentage planning to raise employment fell to zero. The percentage of respondents with one or more job openings improved to 14%, the least since 1992. During the last ten years there has been a 71% correlation between the NFIB employment percentage and the y/y change in nonfarm payrolls.
The largest, single most important problems seen by business were poor sales (23%), inflation (11%), insurance cost and availability (11%) and taxes (18%). The latter, however, still was reduced from 27% in early 2007.
The percentage of firms actually raising prices fell to 15%, the lowest level since February. During the last ten years there has been a 69% correlation between the y/y change in the producer price index and the level of the NFIB price index. The percentage of firms planning to raise prices also fell further to 18% which was the least since 2003
About 24 million businesses exist in the United States. Small business creates 80% of all new jobs in America.
The NFIB figures can be found in Haver's SURVEYS database.
Toward A Durable Recovery is last week's speech by Atlanta Fed Bank President Dennis P. Lockhart and it available here.
| Nat'l Federation of Independent Business | October | September | Y/Y | 2007 | 2006 | 2005 |
|---|---|---|---|---|---|---|
| Small Business Optimism Index (1986=100) | 87.5 | 92.9 | -9.0% | 96.7 | 98.9 | 101.6 |
by Tom Moeller November 11, 2008
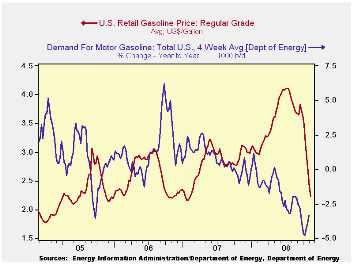
The retail price for a gallon of regular gasoline fell by another eighteen cents last week after the twenty six cent drop during the prior week, according to the U.S. Department of Energy survey. The price of $2.22 was the lowest since February 2007. Prices have now fallen $1.89 per gallon, or by nearly one-half, since their peak early this past July. The latest decline was accompanied by a drop in the average price for all grades of gasoline to $2.28 per gallon.
Yesterday, the spot market price for a gallon of regular
gasoline fell eight cents from last week's average to $1.40. In futures
trading the November contract closed down further at $1.37 per gallon.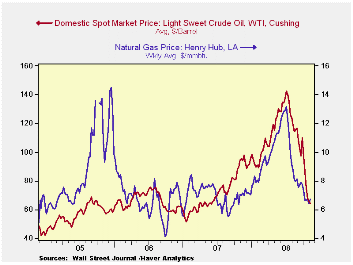
Weekly gasoline prices can be found in Haver's WEEKLY database. Daily prices are in the DAILY database.
The demand for gasoline fell by 3.3% y/y, according to the U.S. Department of Energy. The rate of decline has bottomed out recently but the decline is still the fastest since late-1995 (the latest four weeks versus the same four weeks last year). The demand for all petroleum products also has softened, falling 7.0% y/y.
These DOE figures are available in Haver's OILWKLY database.
The price for a barrel of West Texas Intermediate crude oil fell further last week to an average $64.31 per barrel, down 56% since the peak in July of $145.66. In futures trading yesterday, the two-month price for crude oil was even lower at $63.27 per barrel.
Last week, prices for natural gas ticked up w/w to $6.74 per mmbtu (-3.3% y/y) as seasonal factors began to lift the price. The average price this month was nearly one-half below the high for natural gas prices in early-July of $13.19/mmbtu.
If Exchange Rates Are Random Walks, Then Almost Everything We Say About Monetary Policy Is Wrong from the Federal Reserve Bank of Minneapolis can be found here.
| Weekly Prices | 11/10/08 | 11/03/08 | Y/Y | 2007 | 2006 | 2005 |
|---|---|---|---|---|---|---|
| Retail Regular Gasoline ($ per Gallon) | 2.22 | 2.40 | -28.5% | 2.80 | 2.57 | 2.27 |
| Light Sweet Crude Oil, WTI ($ per bbl.) | 64.31 | 65.68 | -32.5% | 72.25 | 66.12 | 56.60 |
by Tom Moeller November 11, 2008
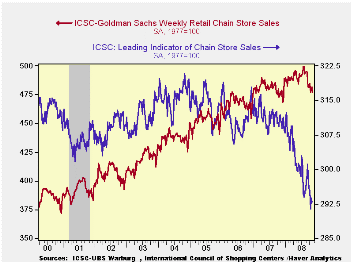
According to the International Council of Shopping Centers-Goldman Sachs Index, chain store sales dropped 1.0% last week from the last week in October. That wasn't the first sign of severe weakness in sales. There was one weekly decline last month and sales were down during each week of September, but the decline did lower the starting level of sales this month 0.7% below the October average. During all of October sales fell 1.0% from September following that month's 1.9% drop.
The level of sales during the latest week remained near the lowest since December of last year. During the last ten years there has been a 59% correlation between the y/y change in chain store sales and the change in nonauto retail sales less gasoline.The ICSC-Goldman Sachs retail chain-store sales index is constructed using the same-store sales (stores open for one year) reported by 78 stores of seven retailers: Dayton Hudson, Federated, Kmart, May, J.C. Penney, Sears and Wal-Mart.
Portending further weakness in consumer spending was a 0.3% dip in the weekly leading indicator of chain store sales from ICSC-Goldman Sachs. The index level was, however, 6.1% below the year ago level at the lowest level since 1996.
The chain store sales figures are available in Haver's SURVEYW database.
| ICSC-UBS (SA, 1977=100) | 11/08/08 | 10/31/08 | Y/Y | 2007 | 2006 | 2005 |
|---|---|---|---|---|---|---|
| Total Weekly Chain Store Sales | 477.2 | 482.0 | 0.4% | 2.8% | 3.3% | 3.6% |
by Louise Curley November 11, 2008
Investors in Germany appear to be encouraged by the steps the
central bank and the government have taken in recent weeks to deal with
the economic slowdown. The European Central Bank reduced it key rate by
50 basis points on October 8 and is expected to reduce it by another 50
basis points on November 12 binging it to 3.25%. In addition, the
German government passed a $64 billion stimulus package on November
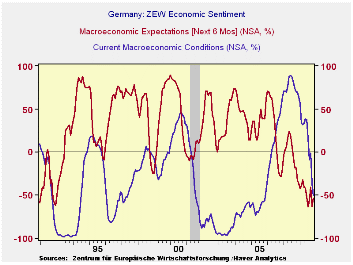
4.In the latest ZEW survey, the excess of pessimists over optimists
regarding future conditions declined to 53.5% in November from 63.0% in
October. This still a far cry from the historical average of an excess
of optimists of 27.1%.In appraising the current situation, German
investors have become more and more pessimistic--or perhaps more
realistic. From an excess of optimists over pessimists of 17% in July,
there is now an excess of pessimists over optimists of 50.4% viewing
the current situation. The ZEW indicators for current and expected
conditions, together with recession shadings for Germany, are shown in
the first chart.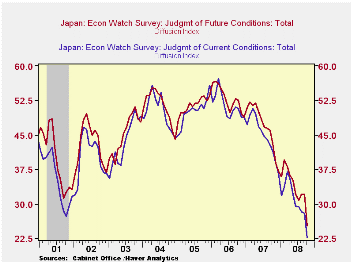
In Japan, the merchants who make up the Economy Watchers Diffusion Index have reported worsening conditions for both for the present and for the future outlooks in almost every month since mid 2007, when the sub prime problem in the U. S. first surfaced. Currently, these indexes are at all time lows as can be seen in the second chart, which plots the history of the diffusion indexes and the recession shading for Japan. The Bank of Japan recently cut its key interest rate to 0.3% from 0.5%, but little has been done in the way of fiscal stimulus.
| Nov 08 | Oct 08 | Sep 07 | Aug 08 | Jul 08 | |
|---|---|---|---|---|---|
| Germany ZEW (% balance) | |||||
| Current Situation | -50.4 | -35.9 | -1.0 | -9.2 | 17.0 |
| Future Conditions | -53.5 | -63.0 | -41.1 | -55.5 | -63.9 |
| Japan Economy Watchers Survey (Dif. Index) | |||||
| Current Conditions | n.a. | 22.6 | 28.0 | 28.3 | 29.3 |
| Future Conditions | n.a. | 25.2 | 32.1 | 32.0 | 30.8 |

Tom Moeller
AuthorMore in Author Profile »Prior to joining Haver Analytics in 2000, Mr. Moeller worked as the Economist at Chancellor Capital Management from 1985 to 1999. There, he developed comprehensive economic forecasts and interpreted economic data for equity and fixed income portfolio managers. Also at Chancellor, Mr. Moeller worked as an equity analyst and was responsible for researching and rating companies in the economically sensitive automobile and housing industries for investment in Chancellor’s equity portfolio. Prior to joining Chancellor, Mr. Moeller was an Economist at Citibank from 1979 to 1984. He also analyzed pricing behavior in the metals industry for the Council on Wage and Price Stability in Washington, D.C. In 1999, Mr. Moeller received the award for most accurate forecast from the Forecasters' Club of New York. From 1990 to 1992 he was President of the New York Association for Business Economists. Mr. Moeller earned an M.B.A. in Finance from Fordham University, where he graduated in 1987. He holds a Bachelor of Arts in Economics from George Washington University.
More Economy in Brief


