 Global| Jan 14 2010
U.S. Retail Sales Weaken AtYearend But 2009 Improved
by:Tom Moeller
|in:Economy in Brief
Summary
d less evident at the end of last year's holiday shopping season. December retail sales slipped 0.3% last month though the November increase was revised up to 1.8% from 1.3% reported last month. The latest figure was weaker than [...]
 d
less evident at the end of last year's holiday shopping
season. December retail sales slipped 0.3% last month though the
November increase was revised up to 1.8% from 1.3% reported last month.
The latest figure was weaker than Consensus expectation for a 0.5%
rise. Reinforcing the notion of a weak end to 2009 was a 0.3% decline
retail sales less autos after an upwardly revised 1.9% jump in November
sales. Aside from the monthly volatility, however, the trend in retail
spending improved. On a three-month basis, retail sales rose at an
11.3% annual rate through December, by far improved from the 29.7% rate
of decline one year earlier. Less autos, the rate of spending also
recovered to 7.1% from negative 28.9% at its depths.
d
less evident at the end of last year's holiday shopping
season. December retail sales slipped 0.3% last month though the
November increase was revised up to 1.8% from 1.3% reported last month.
The latest figure was weaker than Consensus expectation for a 0.5%
rise. Reinforcing the notion of a weak end to 2009 was a 0.3% decline
retail sales less autos after an upwardly revised 1.9% jump in November
sales. Aside from the monthly volatility, however, the trend in retail
spending improved. On a three-month basis, retail sales rose at an
11.3% annual rate through December, by far improved from the 29.7% rate
of decline one year earlier. Less autos, the rate of spending also
recovered to 7.1% from negative 28.9% at its depths.
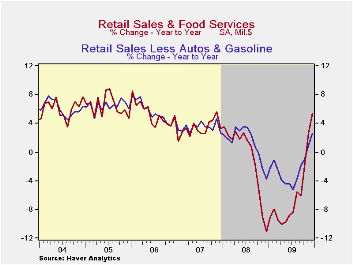
Higher
gasoline prices obviously played a part in the retail sales picture.
Gasoline purchases rose 1.0% last month and they're up by one-third
from last year. 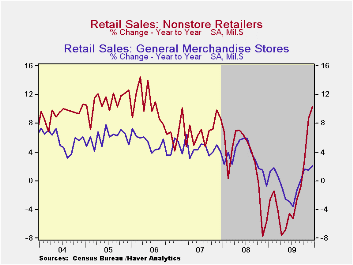 Yet without gasoline there still has been firming in
spending. Less autos & gasoline retail sales fell 0.3% last
month after a 1.0% November jump. On a three-month basis, these sales
rose at a 3.1% rate, up from the worst of -12.2% at the end of 2008.
Yet without gasoline there still has been firming in
spending. Less autos & gasoline retail sales fell 0.3% last
month after a 1.0% November jump. On a three-month basis, these sales
rose at a 3.1% rate, up from the worst of -12.2% at the end of 2008.
It's been internet & catalogue purchases that have shown the bulk of the improvement in retail spending. These sales rose 1.4% in December (10.3% y/y) after similar increases during the prior three months. The three-month rate of gain rose to 21.2% from a negative 22.5% at the end of 2008.
Motor vehicle sales slipped 0.8%
last month after a 1.2% November increase and a 7.4% October gain.
Reflecting price discounts, these changes lag the increases in unit
vehicle sales. Elsewhere, discretionary "core" spending improved some
but 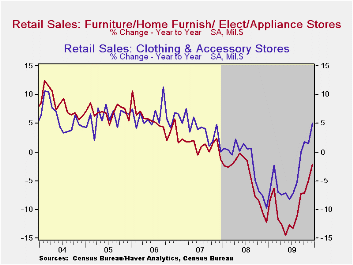 it's been less pronounced. Sales at furniture & appliance
stores fell 1.2% during December (-2.2% y/y) after a 1.8% November
increase. The three-month rate of growth improved to -0.9% from -25.9%
at its worst. Sales at furniture stores alone rose 0.3% after a 0.7%
November gain and three-month growth improved to 0.3% from -21.6% at
its worst. Sales of electronics & appliances fell 2.6% (-0.7%
y/y) and reversed all of the November increase. Three-month growth
slipped to -2.0%. In soft goods, apparel store sales slipped 0.6%
(+5.0% y/y) for the third consecutive monthly decline. General
merchandise store sales fell 0.8% (+2.1% y/y) while three-month growth
improved to 1.7% from -11.2% at its worst late in 2008.
it's been less pronounced. Sales at furniture & appliance
stores fell 1.2% during December (-2.2% y/y) after a 1.8% November
increase. The three-month rate of growth improved to -0.9% from -25.9%
at its worst. Sales at furniture stores alone rose 0.3% after a 0.7%
November gain and three-month growth improved to 0.3% from -21.6% at
its worst. Sales of electronics & appliances fell 2.6% (-0.7%
y/y) and reversed all of the November increase. Three-month growth
slipped to -2.0%. In soft goods, apparel store sales slipped 0.6%
(+5.0% y/y) for the third consecutive monthly decline. General
merchandise store sales fell 0.8% (+2.1% y/y) while three-month growth
improved to 1.7% from -11.2% at its worst late in 2008.
The retail sales data are available in Haver's USECON database.
The Federal Reserve's most recent Beige Book covering regional economic conditions an be found here.
| December | November | October | Y/Y | 2009 | 2008 | 2007 | |
|---|---|---|---|---|---|---|---|
| Total Retail Sales & Food Services (%) | -0.3 | 1.8 | 1.3 | 5.4 | -6.0 | -0.8 | 3.3 |
| Excluding Autos | -0.2 | 1.9 | -0.0 | 5.2 | -4.7 | 2.4 | 3.9 |
| Non-Auto Less Gasoline | -0.3 | 1.0 | 0.1 | 2.3 | -1.8 | 1.6 | 3.6 |
by Robert Brusca January 14, 2010
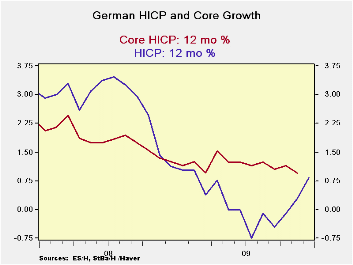
German inflation, while beginning to edge up at year-end in its HICP and CPI formats has registered the lowest annual pace in 20-years. The small two-line panel at the table top shows overall statistics for the German CPI (as opposed to the harmonized HICP treatment) where the core measure is available for December (the core reading is not yet available for the HICP format). In terms of the Germany’s CPI while the headline rate rose at year end, the core rate’s 3-month pace was still declining.
Diffusion measures the breadth of inflation’s acceleration regardless of the pace across categories. Calculated on the various 3-mo 6-mo and 12-mo periods, inflation rates of the HICP across categories reveal that inflation is not accelerating. The diffusion reading of 45.5% over three months is below the neutral mark of 50%.. That statistic means, roughly, that inflation is only accelerating in 45.5% of the categories over three months (compared to six months) and that it is decelerating in 54.5% of the categories. Thus even with the bump up in overall inflation, diffusion tells us that inflation forces are not widespread. And, of course, inflation is low to boot.
While the Bundesbank and the ECB are headline inflation-watchers it must be some solace to them that the Core rate remains so subdued and so steady. In the last cycle the core rate proved to be a very good signal about inflation and how entrenched it had become. Headline inflation failed as an inflation siren as it howled too shrilly in the recession as oil and other commodity prices soared. But the core rate remained pretty low and stable even as the headline soared. The Fed, which takes its cue more from the core rate (it does not target inflation however) had the flexibility to cut rates when it chose. The ECB, in contrast, needed to cut rates as part of international deal on the ‘expectation’ that inflation would recede. Of course, it did recede, but central banks do not like to be cutting rates with inflation over their stated targets.
Nonetheless it is a good end to 2009 on the inflation side. The bump up in headline inflation at year- end is oil- related and it appears to have exerted no pull on core prices. These developments leave us in good stead to take a fresh a look at 2010. So far 2010 is looking like a year in which growth will be a hotter topic than inflation.
| German HICP | |||||||
|---|---|---|---|---|---|---|---|
| Mo/Mo % | Saar % | Yr/Yr | |||||
| Dec-09 | Nov-09 | Oct-09 | 3-Mo | 6-Mo | 12-Mo | Yr Ago | |
| HICP Total | 0.3% | 0.1% | 0.2% | 2.3% | 0.9% | 0.8% | 1.1% |
| Core | #N/A | -0.2% | 0.1% | #N/A | #N/A | #N/A | 1.3% |
| CPI | |||||||
| All | 0.2% | 0.1% | 0.2% | 1.9% | 0.7% | 0.8% | 1.1% |
| CPIxF&E | 0.2% | -0.1% | 0.0% | 0.4% | 1.1% | 1.0% | 1.3% |
| Food | -0.2% | 0.5% | -0.1% | 0.7% | -2.3% | -2.0% | 1.9% |
| Alcohol | -0.3% | -0.5% | 0.0% | -2.9% | -2.0% | -0.9% | 0.7% |
| Clothing & Shoes | 2.3% | -1.4% | 0.2% | 3.9% | 3.9% | 2.5% | 0.7% |
| Rent &Util | 0.0% | 0.2% | -0.1% | 0.4% | -0.2% | -0.2% | 2.5% |
| Health Care | 0.1% | 0.1% | 0.0% | 0.8% | 0.8% | 0.8% | 1.8% |
| Transport | -0.3% | 2.1% | 0.0% | 7.5% | 5.6% | 4.1% | -2.8% |
| Communication | 0.0% | -0.4% | 0.1% | -1.3% | -0.9% | -1.8% | -3.3% |
| Rec &Culture | -0.1% | -0.4% | 0.2% | -1.2% | 0.2% | 0.5% | 1.2% |
| Education | 0.7% | 1.5% | 0.2% | 9.8% | 5.9% | -1.1% | -3.8% |
| Restaurant & Hotel | 0.7% | -0.4% | 0.5% | 3.4% | 2.4% | 1.9% | 2.6% |
| Other | 0.4% | -0.4% | 0.7% | 3.0% | 3.0% | 2.1% | 1.7% |
| Diffusion | -- | -- | -- | 45.5% | 54.5% | 45.5% | -- |
| Type: | Diffusion: Current Compared to | 6-mo | 12-mo | Yr-Ago | |||
by Tom Moeller January 14, 2010
 The
yearend
weakness in oil prices was modest but enough to hold overall monthly
import prices stable. The zero change in December import prices matched
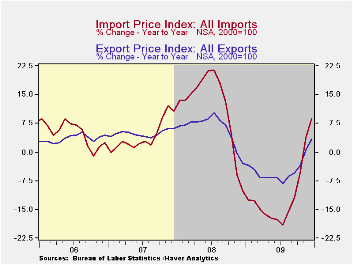
Consensus expectations. For the year as whole, however, the picture was
more dramatic. Import prices fell 11.5% in 2009 and that reversed the
2008 increase. Excluding petroleum, import prices fell 4.1% last year
and reversed most of the 2008 increase.
The
yearend
weakness in oil prices was modest but enough to hold overall monthly
import prices stable. The zero change in December import prices matched
Consensus expectations. For the year as whole, however, the picture was
more dramatic. Import prices fell 11.5% in 2009 and that reversed the
2008 increase. Excluding petroleum, import prices fell 4.1% last year
and reversed most of the 2008 increase.
Petroleum prices slipped 2.0% last month following their 6.3% November increase. For the year overall, the decline in prices reversed the climb in 2008. That pattern masks, however, extreme volatility during the year. By yearend, petroleum prices had nearly doubled the January trough. This month, Brent crude oil prices have strengthened further to nearly $80 per barrel from a low just above $71 last month.
In addition, the
latest report from the U.S. Bureau of Labor Statistics indicated that
non-oil import prices rose 0.5% after a similar gain during November.
The lower value of the dollar has now helped lift these prices at a
6.8% annual rate during the last three months, reversing a 7.3% y/y
decline as of July. 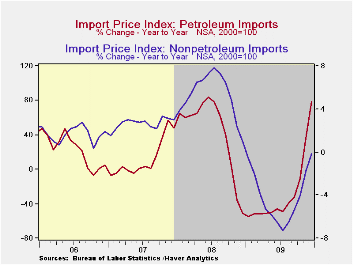 (During the last ten years, there has been a
negative 81% correlation between the nominal trade-weighted exchange
value of the US dollar vs. major currencies and the y/y change in
non-oil import prices.)
(During the last ten years, there has been a
negative 81% correlation between the nominal trade-weighted exchange
value of the US dollar vs. major currencies and the y/y change in
non-oil import prices.)
Excluding petroleum, last year prices reversed most of the 2008 increase and the decline breaks down as follows: Prices for iron & steel mill products fell 28.5% and reversed all the 2008 increase. Chemical prices fell 12.4% after a 24.0% 2008 increase. Food & beverage prices slipped 2.8% after a double-digit 2008 gain. Prices for nonauto consumer goods were weak and slipped 0.3% after a 2.8% increase. That decline reflected a 0.6% decline in durable consumer goods prices which reversed strong gains in the prior two years. Home entertainment equipment prices fell 4.1% last year and extended a decline dating back to 1996. Furniture prices nudged up 0.6% after a 7.1% 2008 increase. Finally, apparel prices slipped 0.1% after strong gains in 2007 and 2008.
Total export prices fell 4.6% last year following strong gains dating back to 2003. The decline reflected a 12.8% drop in agricultural export prices and a 3.7% drop in "non-ag" prices. These declines reversed just some of the strength through 2008.
The import and export price series can be found in Haver's USECON database. Detailed figures are available in the USINT database.
Risks to Sustained Economic Recovery (With Lessons Learned from Winston Churchill and Teddy Roosevelt) from the Federal Reserve Bank of Dallas can be found here.
| Import/Export Prices (NSA, %) | December | November | October | Y/Y | 2009 | 2008 | 2007 |
|---|---|---|---|---|---|---|---|
| Import - All Commodities | 0.0 | 1.6 | 0.9 | 8.6 | -11.5 | 11.5 | 4.2 |
| Petroleum | -2.0 | 6.3 | 2.4 | 78.4 | -35.9 | 37.7 | 11.6 |
| Nonpetroleum | 0.5 | 0.6 | 0.5 | -0.2 | -4.1 | 5.3 | 2.7 |
| Export - All Commodities | 0.6 | 0.9 | 0.0 | 3.4 | -4.6 | 6.0 | 4.9 |
by Tom Moeller January 14, 2010
 The
job
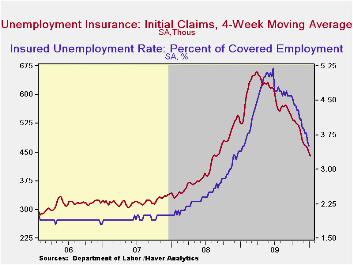
market again deteriorated just slightly last week. The Labor Department
reported that initial claims for jobless insurance rose 11,000 to
444,000 following a 1,000 increase during the prior week. Nevertheless,
claims remained near the lowest level since late in August, 2008 and
were down from the recession peak of 674,000 hit last March. Consensus
expectations has been for an unchanged 433,000. Despite the weekly
gains, the four-week moving average of initial claims also fell to a
new cycle-low of 440,750.
The
job
market again deteriorated just slightly last week. The Labor Department
reported that initial claims for jobless insurance rose 11,000 to
444,000 following a 1,000 increase during the prior week. Nevertheless,
claims remained near the lowest level since late in August, 2008 and
were down from the recession peak of 674,000 hit last March. Consensus
expectations has been for an unchanged 433,000. Despite the weekly
gains, the four-week moving average of initial claims also fell to a
new cycle-low of 440,750.
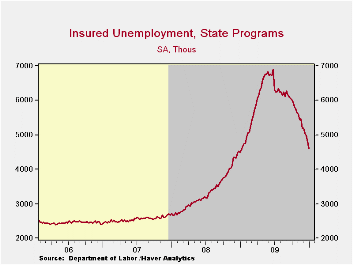
Continuing claims for unemployment insurance during the latest week again fell sharply. The 211,000 drop was the largest since late-November and part of a one-third decline since late-June. Continuing claims were at the lowest level since mid-January of last year. The overall decline is a function of the improved job market but also reflects the exhaustion of 26 weeks of unemployment benefits. Continuing claims provide an indication of workers' ability to find employment. The four-week average of continuing claims fell to 4,855,00. This series dates back to 1966. · Extended benefits for unemployment insurance ticked up slightly to 302,272 during the fourth week of December but remained down by one-half from the peak reached during November of 597,688.
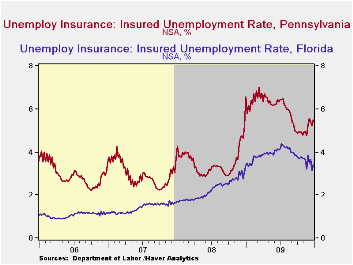
The insured rate of unemployment also fell to a new low of 3.5%. The rate reached a high of 5.2% during late-June. During the last ten years, there has been a 93% correlation between the level of the insured unemployment rate and the overall rate of unemployment published by the Bureau of Labor Statistics.
The highest insured unemployment rates in the week ending December 26 were in Alaska (7.4 percent), Oregon (6.6), Idaho (6.2), Wisconsin (6.2), Michigan (5.9), Montana (5.7), Nevada (5.7), North Carolina (5.6), Pennsylvania (5.5), and Washington (5.4). The lowest insured unemployment rates were in Virginia (2.1%), North Dakota (2.5), Texas (2.6), Maryland (3.0), Florida (3.4), Wyoming (3.4), Ohio (3.7), Maine (3.7), New York (4.0) and Mississippi (4.2). These data are not seasonally adjusted but the overall insured unemployment rate is.
The unemployment insurance claims data is available in Haver's WEEKLY database and the state data is in the REGIONW database.
Labor Market Globalization in the Recession and Beyond from the Federal Reserve Bank of Dallas is available here.
| Unemployment Insurance (000s) | 1/8/10 | 1/1/10 | 12/25/09 | Y/Y | 2009 | 2008 | 2007 |
|---|---|---|---|---|---|---|---|
| Initial Claims | 444 | 433 | 432 | -17.0% | 573 | 419 | 321 |
| Continuing Claims | -- | 4,596 | 4,807 | 2.4% | 5,835 | 3,345 | 2,552 |
| Insured Unemployment Rate (%) | -- | 3.5 | 3.6 | 3.5 (1/2009) | 4.4 | 2.5 | 1.9 |
by Carol Stone January 14, 2010
 Business
inventories grew again in November, expanding for a second month by
0.4%. These two gains followed 13 consecutive monthly
declines. As in October, the November increase occurred at
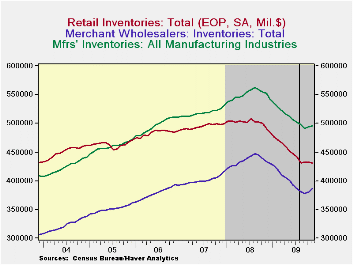
wholesalers and manufacturers; retailers apart from motor vehicle
dealers continued to reduce their stocks of merchandise.
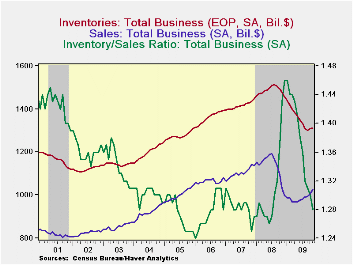
Business sales also grew in November and the resulting inventory/sales
ratio fell to 1.28 from 1.30 in October.
Business
inventories grew again in November, expanding for a second month by
0.4%. These two gains followed 13 consecutive monthly
declines. As in October, the November increase occurred at
wholesalers and manufacturers; retailers apart from motor vehicle
dealers continued to reduce their stocks of merchandise.
Business sales also grew in November and the resulting inventory/sales
ratio fell to 1.28 from 1.30 in October.
The manufacturing and wholesale inventories gains were, as in October, largest for petroleum and also food and farm products. We presume these are mostly price-driven. In both sectors, there were also some buildup in stocks of computer equipment and scattered increases in various metals industries.
Total retail inventories resumed downward movement in November after being flat in October. Cuts were widespread in the nonautomotive segments, especially including furniture, building materials, clothing and general merchandise. Auto dealer inventories edged up, but just 0.1%, after a 0.6% rise in October, and food stores saw marginal increases both months.
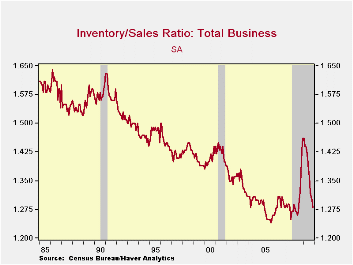
Retailers' inventory/sales ratio fell to 1.37 from 1.40 in October and 1.60 a year earlier. Wholesalers' sales surged 3.3% in November, pushing their I/S ratio down to 1.14 from 1.17 the month before. And manufacturers' shipments were up 1.0% in November, so that their I/S ratio decreased to 1.32 from 1.34 in October. As indicated in the graph, these stock adjustments bring the relationship of stocks to sales back to the general range that was prevailing in the months before the economy's mid-2008 collapse. With such tight inventory control techniques now in wide use, it's hard to know whether the low inventory positions are so undesirably "low" compared to sales by now that stronger production schedules are guaranteed, but at least the necessary corrections do seem to have been accomplished.
The business sales and inventory data are available in Haver's USECON database.
| Business Inventories (%) | November | October | September | Y/Y | 2008 | 2007 | 2006 |
|---|---|---|---|---|---|---|---|
| Total | 0.4 | 0.4 | -0.5 | -11.1 | 0.6 | 4.0 | 6.4 |
| Retail | -0.2 | 0.0 | 0.5 | -12.0 | -3.1 | 2.5 | 3.3 |
| Retail excl. Auto | -0.4 | -0.2 | -0.7 | -6.6 | -1.8 | 2.7 | 4.7 |
| Wholesale | 1.5 | 0.6 | -0.8 | -11.0 | 3.1 | 6.2 | 8.2 |
| Manufacturing | 0.2 | 0.6 | -1.3 | -10.3 | 2.1 | 3.7 | 8.2 |

Tom Moeller
AuthorMore in Author Profile »Prior to joining Haver Analytics in 2000, Mr. Moeller worked as the Economist at Chancellor Capital Management from 1985 to 1999. There, he developed comprehensive economic forecasts and interpreted economic data for equity and fixed income portfolio managers. Also at Chancellor, Mr. Moeller worked as an equity analyst and was responsible for researching and rating companies in the economically sensitive automobile and housing industries for investment in Chancellor’s equity portfolio. Prior to joining Chancellor, Mr. Moeller was an Economist at Citibank from 1979 to 1984. He also analyzed pricing behavior in the metals industry for the Council on Wage and Price Stability in Washington, D.C. In 1999, Mr. Moeller received the award for most accurate forecast from the Forecasters' Club of New York. From 1990 to 1992 he was President of the New York Association for Business Economists. Mr. Moeller earned an M.B.A. in Finance from Fordham University, where he graduated in 1987. He holds a Bachelor of Arts in Economics from George Washington University.
More Economy in Brief


