 Global| Feb 14 2006
U.S. Retail Sales Surged As Temperatures Warmed
by:Tom Moeller
|in:Economy in Brief
Summary
January US retail sales surged 2.3% as temperatures posted record highs. The increase by far exceeded Consensus expectations for a 0.8% gain and the December increase was revised down to 0.4% due to a lowered estimate of auto sales. [...]
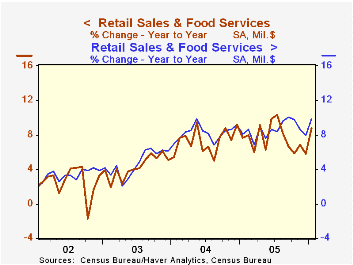
January US retail sales surged 2.3% as temperatures posted record highs. The increase by far exceeded Consensus expectations for a 0.8% gain and the December increase was revised down to 0.4% due to a lowered estimate of auto sales.
Unseasonably warm temperatures in the U.S. last month were evident in the record low number (662) of heating degree days which were down 22% from the warm January 2005.
Sales by motor vehicle & parts dealers rose 2.9% (4.9% y/y) and the increase about matched the 2.7% m/m rise in unit auto sales.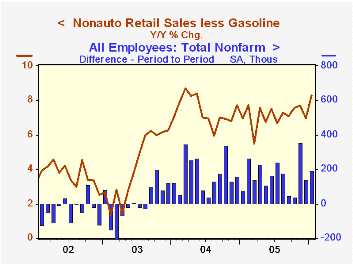
Discretionary spending surged as consumers went shopping. Apparel store sales jumped 4.2% (10.0% y/y) following marginal declines during the prior two months. General merchandise store sales surged 2.1% (7.4% y/y) after no change in December and sales of furniture, electronics & appliances recovered 2.9% (7.9% y/y) after a downwardly revised 1.0% December decline.
Building material sales certainly benefited from the mild weather and jumped 3.4% (14.7% y/y).
Sales at gasoline stations rebounded following three consecutive months of decline. The 5.5% rise, however, lagged the 6.0% m/m recovery in gasoline prices. In February, gasoline prices have averaged about the same level as during January.
Less gasoline, nonauto retail sales spiked 1.8% (8.3% y/y) and the December increase was revised up to 0.3%.
Sales of nonstore retailers (internet & catalogue) dropped 2.6% (8.3% y/y).
| Jan | Dec | Y/Y | 2005 | 2004 | 2003 | |
|---|---|---|---|---|---|---|
| Retail Sales & Food Services | 2.3% | 0.4% | 8.8% | 7.5% | 7.3% | 4.3% |
| Excluding Autos | 2.2% | 0.2% | 9.9% | 8.6% | 8.2% | 4.7% |
by Tom Moeller February 14, 2006
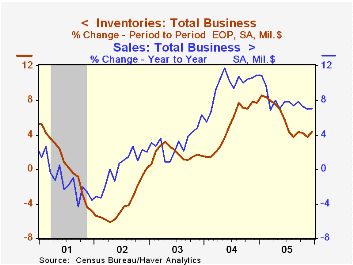
Total business inventories posted another solid increase during December. The 0.7% increase followed an upwardly revised 0.6% November gain and was firmer than the 0.4% Consensus expectation.
The latest increases, however, have lagged the firm growth in business sales. As a result the ratio of inventories-to-sales fell back to the postwar low of 1.25.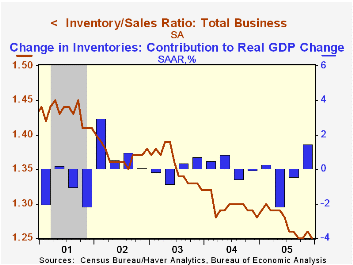
Retail inventories gained 0.7% after an upwardly revised 1.0% November rise. A 0.9% rise in motor vehicle inventories was the fifth in as many months but auto inventories still fell 0.6% y/y. Retail inventories less autos rose 0.6% as furniture inventories increased 0.8% (3.5% y/y). Apparel inventories also rose a firm 0.6% (5.2$ % y/y) and general merchandise inventories posted a 0.6% (4.6% y/y) gain.
Wholesale inventories jumped 1.0% as imports on nonpetroleum goods jumped 3.4% (8.1% y/y). During the last ten years there has been a 67% correlation between the y/y change in wholesale inventories and the change in imports of nonpetroleum goods.
Factory sector inventories added to the prior month's gain and rose 0.5%.
| Business Inventories | Dec | Nov | 2005 | 2004 | 2003 |
|---|---|---|---|---|---|
| Total | 0.7% | 0.6% | 4.3% | 7.7% | 1.5% |
| Retail | 0.7% | 1.0% | 2.7% | 5.5% | 3.9% |
| Retail excl. Autos | 0.6% | 0.4% | 4.4% | 5.9% | 2.0% |
| Wholesale | 1.0% | 0.5% | 6.7% | 10.8% | 2.0% |
| Manufacturing | 0.5% | 0.3% | 4.3% | 7.7% | -1.1% |
by Tom Moeller February 14, 2006
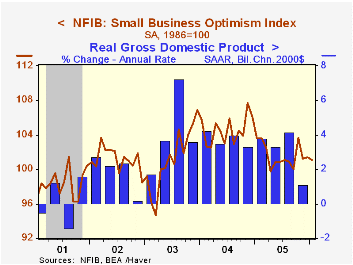
The January index of small business optimism from the National Federation of Independent Business (NFIB) reversed the small December rise and fell 0.3%. The latest index level was 6.1% lower than the peak during November 2004.
The latest m/m decline reflected fewer firms (6%) firms expecting the expecting the economy to improve, down from a high 51% during late 2003, although the percentage with one or more job openings jumped to the highest level (26%) since 2001.
During the last ten years there has been a 70% correlation between the level of the NFIB index and the two quarter change in real GDP.
The percentage of firms planning to raise average selling prices rose to 29% from 27% during all of last year but the percentage of firms actually raising average selling prices was stable at 18%, down from a 22% average during 2005. During the last ten years there has been a 60% correlation between the change in the producer price index and the level of the NFIB price index.
About 24 million businesses exist in the United States. Small business creates 80% of all new jobs in America.
| Nat'l Federation of Independent Business | Jan | Dec | Y/Y | 2005 | 2004 | 2003 |
|---|---|---|---|---|---|---|
| Small Business Optimism Index (1986=100) | 101.1 | 101.4 | -2.4% | 101.6 | 104.6 | 101.3 |
by Tom Moeller February 14, 2006
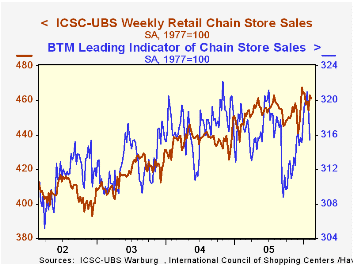
Chain store sales dipped 0.4% last week following a 2.0% surge during the opening week of February, according to the International Council of Shopping Centers (ICSC)-UBS survey.
So far in February sales are 0.7% ahead of the January average which rose 1.0% from December.
The leading indicator of chain store sales fell sharply for the second consecutive week The 1.1% w/w decline lowered the February level 1.4% below the January average.The ICSC-UBS retail chain-store sales index is constructed using the same-store sales (stores open for one year) reported by 78 stores of seven retailers: Dayton Hudson, Federated, Kmart, May, J.C. Penney, Sears and Wal-Mart.
| ICSC-UBS (SA, 1977=100) | 02/11/06 | 02/04/06 | Y/Y | 2005 | 2004 | 2003 |
|---|---|---|---|---|---|---|
| Total Weekly Chain Store Sales | 460.9 | 462.9 | 3.3% | 3.6% | 4.7% | 2.9% |
by Louise Curley February 14, 2006
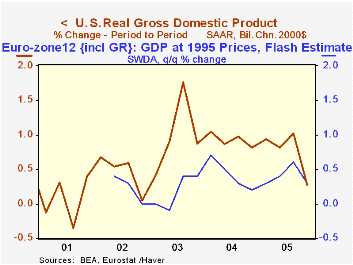
According to flash estimates published today, growth in real gross domestic product of the twenty-five countries of the European Union slowed to 0.4% in the fourth quarter of 2005, down from a 0.6% increase in the third quarter. Growth in the Euro Zone, alone, was 0.3%, down from a 0.6% increase in the third quarter. Incidentally, the slowdowns in the fourth quarter in the Euro Zone and in the EU were less marked than that of the United States, where fourth quarter growth fell to 0.3% from 1.0% in the third quarter.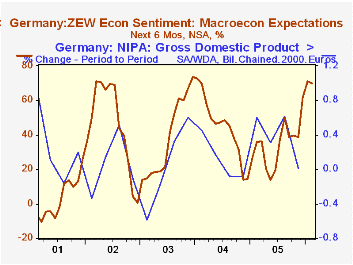 As a result, growth in the Euro Zone equaled the 0.3% quarter-to-quarter growth of the U. S., and growth in the European Union was greater than that of the U.S. for the first time since comparable data on the Euro Zone and EU have been available. The first chart compares the quarter-to-quarter growth rates in GDP in the U.S. and the Euro Zone.
Within the Euro Zone there was a marked slowdown in Germany, from 0.6% growth in the third quarter to practically zero in the fourth. Growth in France also decelerated from 0.7% in the third quarter to 0.2% in the fourth. There were, however, countries where growth picked up in the fourth quarter--Spain and Austria among them.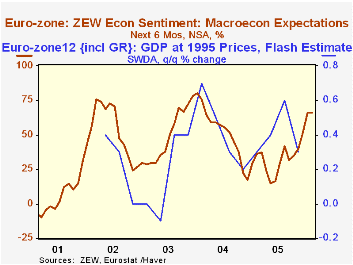
In spite of the fourth quarter slowdown, the institutional investors and analysts of the ZEW survey remain confident that conditions will improve over the next six months. In Germany, the balance of those expecting improvement over those expecting a worsening was 69.8% in February, very little changed from the 71% in January. As recently as May, 2005, the balance of optimists was only 13.9%. The second chart plots the balance of the optimists over the pessimists with the quarterly change in real GDP for Germany. A similar picture is shown in the third chart for the Euro Zone as a whole. The balance of optimists over pessimists was 66.0% in February, virtually identical with January's 66.1% and well above the May 2005 low point of 14.8%.
| Gross Domestic Product (Q/Q % Change) | Q4 05 | Q3 05 | Q2 05 | Q1 05 | -- | -- | -- |
|---|---|---|---|---|---|---|---|
| United States | 0.3 | 1.0 | 0.8 | 0.9 | -- | -- | -- |
| EU (25) | 0.4 | 0.6 | 0.5 | 0.3 | -- | -- | -- |
| Euro Zone (12) | 0.3 | 0.4 | 0.6 | 0.3 | -- | -- | -- |
| Germany | 0.0 | 0.6 | 0.3 | 0.6 | -- | -- | -- |
| France | 0.2 | 0.7 | 0.0 | 0.3 | -- | -- | -- |
| Spain | 0.9 | 0.8 | 0.8 | 0.9 | -- | -- | -- |
| Austria | 0.7 | 0.5 | 0.5 | 0.2 | -- | -- | -- |
| ZEW Financial Market Survey Expectations 6 months ahead (% balance) | Feb 06 | Jan 06 | Dec 05 | Nov 05 | 2005 | 2004 | 2003 |
| Germany | 69.8 | 71.0 | 61.6 | 38.7 | 34.8 | 44.6 | 38.4 |
| Euro zone | 66.0 | 66.1 | 51.2 | 40.0 | 32.3 | 52.1 | 48.1 |

Tom Moeller
AuthorMore in Author Profile »Prior to joining Haver Analytics in 2000, Mr. Moeller worked as the Economist at Chancellor Capital Management from 1985 to 1999. There, he developed comprehensive economic forecasts and interpreted economic data for equity and fixed income portfolio managers. Also at Chancellor, Mr. Moeller worked as an equity analyst and was responsible for researching and rating companies in the economically sensitive automobile and housing industries for investment in Chancellor’s equity portfolio. Prior to joining Chancellor, Mr. Moeller was an Economist at Citibank from 1979 to 1984. He also analyzed pricing behavior in the metals industry for the Council on Wage and Price Stability in Washington, D.C. In 1999, Mr. Moeller received the award for most accurate forecast from the Forecasters' Club of New York. From 1990 to 1992 he was President of the New York Association for Business Economists. Mr. Moeller earned an M.B.A. in Finance from Fordham University, where he graduated in 1987. He holds a Bachelor of Arts in Economics from George Washington University.
More Economy in Brief


