 Global| Apr 16 2007
U.S. Retail Sales Show Unexpected True Strength for March and in Q1
Summary
The U.S. Census Bureau announced today that advance estimates of U.S. retail and food services sales for March, adjusted for seasonal variation and holiday and trading-day differences, but not for price changes, showed an increase of [...]
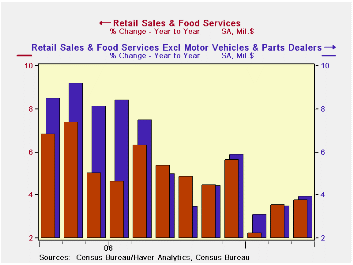
The U.S. Census Bureau announced today that advance estimates of U.S. retail and food services sales for March, adjusted for seasonal variation and holiday and trading-day differences, but not for price changes, showed an increase of 0.7 percent from the previous month. It is also up 3.8 percent from March 2006. Total sales for the January through March 2007 period were up 3.2 percent from the same period a year ago. The January 2007 to February 2007 percent change was revised from 0.1 percent to 0.5 percent. As result, spending in the first quarter is looking more solid.
Bolstered by Easter shopping, retail trade sales alone were up 0.6 percent from February 2007 and were 3.6 percent above last year. Clothing and clothing accessories stores were up 8.0 percent from March 2006 and sales of general merchandise stores were up by a solid 5.8 percent from last year.
The table below tells the story…. Service station sales we up strongly based on the sharp rise in gasoline prices in the month (+3.1% and +13.9% SAARr over three months). The strength in the spring clothing sales are apparent in clothing and general merchandise selling strength in March. Of the main retail categories, only nonstore shopping (catalogue, mail order and internet) was negative.
Good weather may have helped to boost building materials spending but spending on furniture and electronics, another category that is solely linked to home sales (that have been weak), continued to stagger in the month.
In quarterly terms, retail sales are up at a nominal pace of 5.7%. Excluding motor vehicles and gasoline sales, the quarterly rise drops to a pace of 4.6%, but that is quite a respectable gain with oil taken out of the equation. Still, the core CPI is rising at a 3% pace over the first two months of the year. There is some considerable inflation gnawing away at these gains reducing the impact in real terms. But for total consumer spending we have to factor in services spending that has been pretty firm. Consumer spending probably made a real gain in Q1 of between 2% and 2.5% and could be closer to the top of that range.
Meanwhile some hopeful trends are in place. Building materials trend is showing some gains and overall sales trends have stabilized. The two weakest broad retail categories are medical care expenditures where the three month growth rate is down to 1.9% and nonstore retailers where the three month sales change is negative. Also, eating and drinking places expenditures is a discretionary type of spending where sales have contracted by 2.8% over the most recent three months.
We are left with a good monthly report and stabilized trends. However, the report remains a patchwork of mixed trends with sectors still in a state of flux. In the April report we will see how much the shift in Easter affected sales (despite seasonal adjustments that try to account for this shift).
| Mo/Mo | Seasonally Adjusted Annual Rate | ||||
| Retail Aggregates | 2007 Mar | 3-Mo | 6-Mo | Yr/Yr | Year Ago Y/Y |
| Retail & Food Service | 0.7% | 4.7% | 5.4% | 3.8% | 7.6% |
| Retail excl Motor Vehicles & Parts | 0.8% | 5.5% | 5.6% | 3.9% | 9.2% |
| Retail excl Motor Vehicles & Parts & Gas | 0.4% | 3.7% | 4.5% | 3.8% | 9.0% |
| Durables | 2007 Mar | 3-Mo | 6-Mo | Yr/Yr | Year Ago Y/Y |
| Totals | 0.5% | 2.2% | 3.7% | 1.2% | 6.6% |
| Building Materials | 1.4% | 6.3% | 3.0% | -4.4% | 17.8% |
| Motor Vehicles & Parts | 0.4% | 1.8% | 4.6% | 3.2% | 2.1% |
| Motor Vehicles Dealers | 0.3% | 1.6% | 5.0% | 3.4% | 1.8% |
| Furniture, electronics | -0.6% | -2.5% | 1.3% | 2.4% | 8.8% |
| Non durables | 2007 Mar | 3-Mo | 6-Mo | Yr/Yr | Year Ago Y/Y |
| Totals | 0.8% | 6.0% | 6.2% | 5.2% | 8.1% |
| Food & Beverages | 0.2% | 4.7% | 7.5% | 5.7% | 4.7% |
| Health | 0.1% | 1.9% | 4.8% | 5.1% | 8.4% |
| Gasoline | 3.1% | 19.9% | 14.1% | 5.2% | 10.7% |
| Clothing | 2.4% | 13.9% | 5.0% | 8.0% | 7.3% |
| Sport Goods | 1.1% | 8.9% | -0.6% | -1.0% | 6.8% |
| General Merchandise | 1.1% | 6.2% | 5.6% | 5.8% | 5.6% |
| Nonstore Retailers | -3.3% | 7.9% | 4.3% | 4.4% | 15.2% |
| Miscellaneous Retail | 0.6% | 1.9% | 4.8% | 5.1% | 8.4% |
| Non Durables excl Gas | 0.4% | 3.9% | 5.0% | 5.2% | 7.7% |
| Services | |||||
| Food Service & Drinking | 1.2% | -2.8% | 4.8% | 5.3% | 9.6% |
by Robert Brusca April 16, 2007
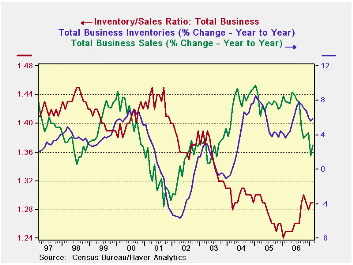
For business overall, the Inventory/Sales ratio (I/S ratio) has roughly stabilized above its recent low and slightly off peak. This has been achieved by reductions in the pace of sales and in the pace of inventory accumulation. The recent fall off has been about the same for inventories and sales but has not been the same for all sectors, and that’s where we find some lingering problems. There is some complication in discussing the I/S ratio since the ratio has been in a long secular decline. But with the low hit in January 2006 that trend seems to have been set aside. As a result we need to pick a recent horizon to assess I/S ratios. I choose a time frame of three years for that purpose.
Table 1 below shows the inventory/sales ratios across the major business groups, manufacturing, retailing and wholesaling. We also look at max and min statistics over the past three years in this table. To the right in that table you will find a column labeled “%-Tile”. That column puts each sector’s I/S ratio in the percentile of the range it has occupied over the past three years. There we find retailer inventories are low by this standard, as they reside in the bottom 20th percentile of their range. Wholesalers are perhaps about right with the ratio in the middle of its range. Manufacturing is in trouble for even as sales have softened and inventory growth has been reduced, the ratio of inventories to sales is still the highest it has been over the past three years in that sector. That is to say that manufactures have not yet adjusted output to the weaker pace of sales. And of course, we have no indications that the pace of sales is picking up either.
Table 2 below shows the paired growth rates across sectors and through time. These trends underlie the shifts in I/S ratios. You can view the S to I growth rate relationship in each period directly or peruse the time series of growth rates for say sales as its changes from a year ago to the current yr/yr pace to six months to three months.
Two out of three is not bad, but not good enough…
Of the three business sectors, two seem to be turning the corner and the other seems mired in a business quicksand of sorts. For overall business, sales rates have declined but they have not declined monotonically across the time groupings in the table, having rebounded in the recent three months.
Manufacturing: For manufactures the current three-month sales growth rate is still negative and the associated inventory growth rate is still positive, thus I/S problems are clearly still being exacerbated there. That’s bad news.
Retail: In retailing the recent 3-month sales bounce is strong in that there is barely any degradation when compared to the Yr/Yr pace. And the Yr/Yr pace for inventories is only slightly stronger for 3-month than over the past year. Moreover since sales are growing faster – much faster - than inventories, that sector seems OK.
Wholesaling: For wholesaling, the recent three-month sales growth rate is up strongly as well but it is noticeably weaker than its Yr/Yr rate of growth. But this sector is also quite healthy since sales are growing at about twice the pace of inventories, showing us that inventory adjustment seems to have been made smoothly.
Indeed if growth gaps like those between I and S persist inventory building will be in order for both wholesalers and retailers. Manufacturing is another sad story.
For now the inventory report paints a promising picture in wholesaling and retailing but continues to paint a bleak one in manufacturing where PMI surveys and orders data also show that other troubles lurk.
| Table 1. Inventory-to-Sales Ratios In Perspective Over three Years | |||||||||
|---|---|---|---|---|---|---|---|---|---|
| 2007 February | Current | 3-Mo Ago | 6-Mo Ago | Year Ago | 2 Years Ago | 3 Years Ago | %-tile | Max | Min |
| Total Business | 1.29 | 1.29 | 1.26 | 1.25 | 1.30 | 1.31 | 71.4% | 1.31 | 1.24 |
| Manufacturers | 1.25 | 1.23 | 1.17 | 1.16 | 1.21 | 1.22 | 100.0% | 1.25 | 1.15 |
| Retailers | 1.48 | 1.50 | 1.50 | 1.48 | 1.55 | 1.55 | 20.0% | 1.6 | 1.45 |
| Wholesalers | 1.15 | 1.16 | 1.13 | 1.14 | 1.17 | 1.17 | 50.0% | 1.18 | 1.12 |
| 2007 February | 3-Mo Growth | 6-Mo Growth | 12-Mo Growth | Year Ago Growth | ||||
| Sales | Inventory | Sales | Inventory | Sales | Inventory | Sales | Inventory | |
| Total Business | 3.3% | 2.3% | -2.3% | 2.6% | 2.9% | 5.9% | 7.9% | 3.7% |
| Manufacturers | -3.5% | 1.0% | -9.4% | 2.8% | -1.0% | 6.4% | 6.6% | 2.5% |
| Retailers | 7.0% | 2.9% | 2.5% | 0.0% | 3.4% | 3.5% | 7.2% | 2.5% |
| Wholesalers | 8.0% | 3.4% | 1.6% | 5.7% | 7.1% | 8.3% | 10.2% | 6.8% |
by Louise Curley April 16, 2007
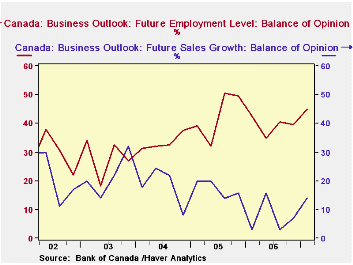
The results of the Quarterly Survey undertaken by the Regional offices of the Bank of Canada were released today. The Survey is based on the opinions of senior management of 100 firms across Canada. The Bank cautions that while the method of selection ensures a good cross section of opinion, the statistical reliability of the survey is limited, given its small size. Given that caveat some of the results are listed below.
The difference between those senior managers who believe sales will improve and those who believe they will decline increased in the latest survey to 14.00% in the latest Survey, from 6.93% in the Winter Survey and 2.97% in the Spring Survey of 2006. Nevertheless, the conviction that sales will continue to improve appears to be lessening as trend in the balance of opinion on future sales has been down since the end of 2003. In spite of declining trend in the balance of opinion on the future of sales, there is a rising trend in balance of those managers expecting employment to increase and those expecting it to decline. In the latest Survey, there were 45% more managers who expected employment to increase than those who expected employment to decline. The contrast between the trends in Sales and Employment outlooks are shown in the first chart.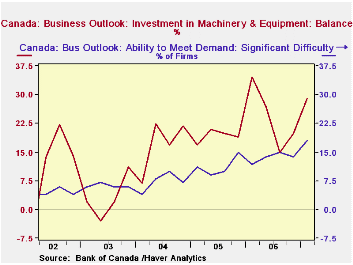
The increased balance of those managers experiencing significant difficulty in meeting demand is consistent with the rising trend in balance of those expecting to increase expenditures on plant and equipment, as shown in the second chart.
The percentage of the managers who expect inflation to be within the 1-3% range that the Bank of Canada considers its control range increased to 88% from 86.1% in the last survey and 78.2% in the Spring Survey of 2006. The third chart shows the percentage of respondents who expected inflation to be under 1% or above 3% and those who expected it to be between 1 and 3%.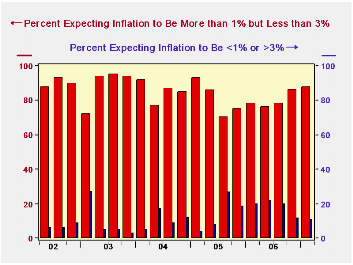
| BUSINESS OUTLOOK SURVEY, BY THE REGIONAL OFFICES OF THE BANK OF CANADA (Percent Balances) | Mar 07 | Feb 07 | Mar 06 | M/M Dif | Y/Y Dif | 2006 | 2005 | 2004 |
|---|---|---|---|---|---|---|---|---|
| Future Sales Outlook | 14.00 | 6.93 | 2.97 | 7.07 | 11.03 | 7.18 | 17.43 | 17.91 |
| Future Employment Level | 45.00 | 39.60 | 42.57 | 5.40 | 2.73 | 39.35 | 42.75 | 33.42 |
| Investment in Plant and Equipment | 29.00 | 19.80 | 34.65 | 9.20 | -5.65 | 24.01 | 19.20 | 16.95 |
| Significant Difficulty in Meeting Demand (%) | 18.00 | 13.90 | 11.90 | 4.10 | 6.10 | 13.65 | 11.20 | 7.25 |
| Inflation Expectations (%)* | ||||||||
| Under 1% or Over 3% | 11.0 | 11.9 | 19.8 | -0.9 | -8.8 | 18.32 | 14.37 | 10.75 |
| Between 1% and 3%. | 88.0 | 86.1 | 78.2 | 1.1 | 9.8 | 79.72 | 81.15 | 85.25 |
by Robert Brusca April 16, 2007
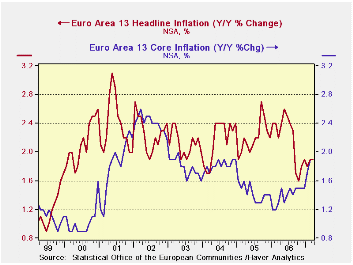
The EU-13 headline HICP rose sharply and so did the core measure in March. Goods prices had all of the momentum, as services prices were dead flat in the month.
As for broad trends, the HICP and the HICP Core for the EU-13 shows pressure in both measures. The year-over-year growth rate for the core had dropped to a low of 1.2% in early 2006. But since then the Core has been in the grip of a steady upward trend for the year-over-year rate. It now stands at 1.9%, a bit higher that it was in 2003 and 2004 before the drop in the core set in. And there is still the question about upward momentum.
However the sequential growth rates are in better shape, in the sense that their signal is not as clearly bad as the year-over-year pattern for the core (see the table). They show an acceleration in goods prices from 1-year to 6-months to 3-months, but Service sector inflation does not have a real definable trend. It is growing at a 1.8% pace over three months, however. Despite the break in services inflation for the month of March the trend has not broken lower in terms of sequential growth rates.
Sequential trends for Core rates across Main EMU countries show mixed patterns. For all the main EMU countries 3-month inflation pressure has been alleviated in the recent period compared to earlier in the year. In the case of Spain inflation has been steadily decelerating from the year/year pace of one year ago (2.8%) to -1.8% over the recent three months. Italy also shows deceleration within the current year.
| % Mo/Mo | % SAAR | ||||||
| Mar-07 | Feb-07 | Jan-07 | 3-Mo | 6-Mo | 12-Mo | Yr Ago | |
| EU-13 | 0.7% | 0.3% | -0.5% | 1.8% | 1.9% | 1.9% | 2.2% |
| Core | 0.7% | 0.4% | -0.9% | 0.7% | 2.1% | 1.9% | 1.3% |
| Goods | 1.1% | 0.1% | -0.8% | 1.8% | 1.6% | 1.7% | 2.4% |
| Services | 0.0% | 0.5% | -0.1% | 1.8% | 2.4% | 2.4% | 1.9% |
| HICP | |||||||
| Germany | 0.2% | 0.5% | -0.2% | 2.0% | 2.8% | 2.0% | 1.9% |
| France | 0.5% | 0.2% | -0.4% | 1.2% | 0.8% | 1.2% | 1.7% |
| Italy | 1.2% | 0.1% | -1.1% | 0.8% | 1.2% | 2.1% | 2.2% |
| UK | #N/A | 0.5% | -0.8% | #N/A | #N/A | #N/A | 1.8% |
| Spain | 0.8% | 0.1% | -0.7% | 0.5% | 2.1% | 2.5% | 3.9% |
| Core excl Food Energy and Alcohol | |||||||
| Germany | 0.0% | 0.5% | -0.6% | -0.4% | 2.2% | 1.6% | 0.5% |
| France | 0.5% | 0.4% | -0.5% | 1.3% | 1.7% | 1.5% | 1.3% |
| Italy | 1.5% | 0.1% | -1.6% | 0.0% | 1.4% | 2.0% | 1.6% |
| UK | #N/A | 0.4% | -1.0% | #N/A | #N/A | #N/A | 1.2% |
| Spain | 0.7% | 0.1% | -1.3% | -1.8% | 2.6% | 2.6% | 2.8% |

Robert Brusca
AuthorMore in Author Profile »Robert A. Brusca is Chief Economist of Fact and Opinion Economics, a consulting firm he founded in Manhattan. He has been an economist on Wall Street for over 25 years. He has visited central banking and large institutional clients in over 30 countries in his career as an economist. Mr. Brusca was a Divisional Research Chief at the Federal Reserve Bank of NY (Chief of the International Financial markets Division), a Fed Watcher at Irving Trust and Chief Economist at Nikko Securities International. He is widely quoted and appears in various media. Mr. Brusca holds an MA and Ph.D. in economics from Michigan State University and a BA in Economics from the University of Michigan. His research pursues his strong interests in non aligned policy economics as well as international economics. FAO Economics’ research targets investors to assist them in making better investment decisions in stocks, bonds and in a variety of international assets. The company does not manage money and has no conflicts in giving economic advice.
More Economy in Brief


