 Global| Feb 12 2010
U.S. Retail Sales Recover FromYearend Blues
by:Tom Moeller
|in:Economy in Brief
Summary
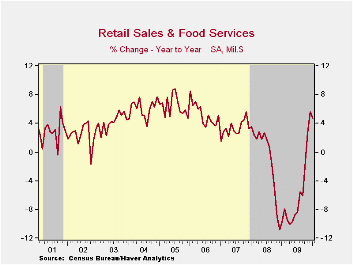
Shoppers are returning to stores after restraining spending at yearend. January retail sales increased 0.5% after a 0.1% decline during December which was less than reported initially. The latest figure was firmer than Consensus [...]
 Shoppers
are
returning to stores after restraining spending at yearend. January
retail sales increased 0.5% after a 0.1% decline during December which
was less than reported initially. The latest figure was firmer than
Consensus expectations for a 0.3% rise. Moreover, the rebound had
nothing to do with shopping for a motor vehicle. Retail sales less
autos rose 0.6% after a 0.2% slip in December that was slightly less
than reported last month. As apparent in earlier figures, the trend in
retail spending has improved. On a three-month basis retail sales rose
at a 9.7% annual rate through January versus the 15.8% rate of decline
one year ago. Less autos, spending growth also recovered on a
three-month basis to 10.1% from -17.9% one year ago.
Shoppers
are
returning to stores after restraining spending at yearend. January
retail sales increased 0.5% after a 0.1% decline during December which
was less than reported initially. The latest figure was firmer than
Consensus expectations for a 0.3% rise. Moreover, the rebound had
nothing to do with shopping for a motor vehicle. Retail sales less
autos rose 0.6% after a 0.2% slip in December that was slightly less
than reported last month. As apparent in earlier figures, the trend in
retail spending has improved. On a three-month basis retail sales rose
at a 9.7% annual rate through January versus the 15.8% rate of decline
one year ago. Less autos, spending growth also recovered on a
three-month basis to 10.1% from -17.9% one year ago.
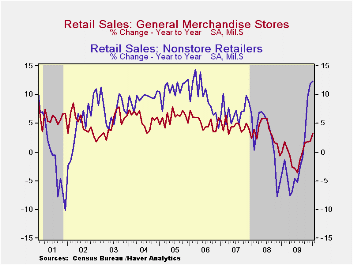
Internet & catalogue sales continued strong. They posted a 1.6% rise in January (12.4% y/y) following similarly strong increases during the prior four months. The three-month rate of gain rose to 28.5% from -9.7% one year ago.
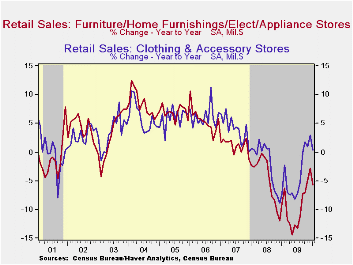
"Core" discretionary spending also improved as general merchandise store sales rose 1.5% (3.2% y/y) and recovered a 1.1% December decline. Sales of electronics & appliances were strong as well and posted a 1.2% gain but remained down 7.0% from last January. Earlier weakness in clothing & accessory stores also stabilized and rose 0.3%, however, price discounting left the y/y gain at just 0.3%. Furniture & home furnishing store sales have yet to recover much. A 1.4% January decline (-4.4% y/y) left the three-month annualized growth rate at a negative 1.3%. That was, however, improved from -21.6% at its worst.
Motor vehicle sales were unchanged last month (5.5% y/y) but that was better than the 4.2% m/m decline in unit sales. Higher gasoline prices played a part in the retail sales picture. Gasoline purchases, however, ticked up just 0.4% (29.0% y/y) even though prices rose 4.0% (50.5% y/y). Sales of building materials fell 1.2% (-6.3% y/y).
The retail sales data are available in Haver's USECON database.
| January | December | November | Y/Y | 2009 | 2008 | 2007 | |
|---|---|---|---|---|---|---|---|
| Total Retail Sales & Food Services (%) | 0.5 | -0.1 | 2.0 | 4.7 | -6.0 | -0.8 | 3.3 |
| Excluding Autos | 0.6 | -0.2 | 2.0 | 4.6 | -4.7 | 2.4 | 3.9 |
| Non-Auto Less Gasoline | 0.6 | -0.3 | 1.1 | 2.0 | -1.9 | 1.6 | 3.6 |
by Robert Brusca February 12, 2010
Don’t judge a book by its cover- Please pardon the bad grammar
in the title. But I am hopelessly imprinted with Rod Stewart’s, “Every
Picture tells, a story, don’t it?’ In this case… I wonder: does it or
as SNL’s Seth Meyers might ask: ‘does it, does it really?’ What I mean
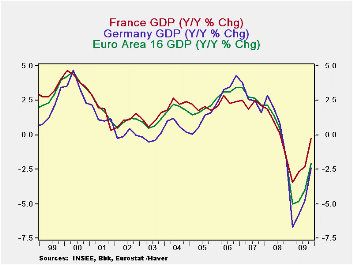
is this: does the picture tell THE story? The story in the picture
above is quite clear that GDP in Europe is getting better and at a fast
rate. The DROP in GDP is cut sharply in its Q4 embodiment compared to
its Q3 embodiment for EMU, Germany and for France.
Digging deeper -- Yet read ANY market story on these results
for today. The clear theme is one of disappointment. Why are people
disappointed if the Yr-over-Yr drops in GDP are dissipating so fast?
It’s because a percentage change is a function of TWO things, the
current value and the past value that forms the base for the percentage
change calculation. And the BIG DROP OFF in the pace of GDP’s decline
Yr/Yr in Europe is more due to a shift in the base than to the result
in the new quarter. In the new quarter GDP rose by only 0.4% at an
annualized rate (that’s a thin 0.1% Q/Q). So why did the yr/yr pace
improve so much? It’s because of the shift in the base to Q4 2008 from
Q3 2008. In Q4 2008 EMU GDP fell by 7.4% at an annualized rate. Compare
that to its 2.7% decline in Q3 of 2008. What this means is that we are
comparing growth in Q4 2009 to a much lower base than we did in
2009-Q3, so even a small amount of growth (like 0.1% in the quarter)
makes the Yr/Yr comparison look much better than it did in Q3. It’s
base-illusion.
Euro-sclerosis strikes again - The simple fact is that
Europe’s recovery is slowing down. The US is speeding up. Europe’s
vaunted social welfare system may have helped to mitigate the declines
in GDP in the recession but in recovery it is providing no springboard
for growth. Meanwhile, the US recovery is powering ahead. We are set up
for the usual sort of configuration in global growth where the US
economy becomes the engine of growth for the global economy as the US
current account deficit rips a gaping hole in the US balance of
payments and feeds stimulus to the rest of world like a mother
breastfeeding her helpless infant child.
You put the load right one me…One problem with this emerging
scenario is that the US consumer is not is the shape he/she usually is
in a recovery and may not be able to suckle the global economy. While
US retail sales were better than expected in January the result is
still less that robust. It is not clear how much lift the US consumer
will add to the US recovery let alone to the economies of the rest of
the world. The US does import a lot of consumer goods. So a recovering
US consumer will purchase imports. But how many imports can the US
consumer buy if US growth goes flat as the diverted income and blunted
multiplier from surging foreign exports to the US stunt economic growth
back home?
The blame game - Get ready for the rest of the world to start
blaming the US for widening deficits even as the US consumer fuels
recovery in Europe and beyond. The simple fact is that China, Japan and
Europe- especially Germany- all want to have export-led growth. They
act as though it’s a right. If they do who will import? China and Japan
have amassed huge foreign exchange reserves, an act that clearly has
facilitated their currencies, remaining weaker than otherwise, enabling
their strategy of export-led growth while at he same time undermining
US growth and US finanical health..
Europe and the 800 pound gorilla - We do not yet have
consumption figures for Europe’s flash GDP results. Flash-GDP is
usually just a total and may be accompanied by some descriptive
comments but little or no supporting details on GDP. Be sure that this
paltry performance from GDP in Europe is not good news. The hike in
reserve requirements in China has people worried about in growth there
as well. There is a theme of growth pessimism taking hold again
clobbering global stock markets. But China is a taker- an exporter- not
a giver. It does not provide net domestic demand to the world. Its
growth merely absorbs income from elsewhere transforming it into growth
for…CHINA! In turn that helps to pressure global input prices
(commodity prices). Strong growth in China is usually not beneficial to
the West. People who profess worry over China growth prospects don’t
get it. It’s a big and growing ever more complicated world. Be sure to
know the facts. Markets often react to overall themes and only later
get more sophisticated by sorting out winners and losers. Right now
there is an emerging theme of weakness. Europe is faltering China may
slow. There are still lingering concerns about the status of growth in
the US…Weakness abroad will have repercussions for the US, but the US
recovery is still on track. So don’t throw out the baby with bath water
in your haste to dump dropping stocks. Markets will eventually ‘get it
right’ and face a truer version of reality. China may be an 800 pound
gorilla but if he is sick and starts eating fewer bananas, there are
more for you.
| European Growth for Selected Flash GDP Results | ||||||
|---|---|---|---|---|---|---|
| Q/Q Saar | Yr/Yr | |||||
| Q4-09 | Q3-09 | Q2-09 | Q4-09 | Q3-09 | Q2-09 | |
| Austria | 3.8% | 9.9% | -3.1% | -1.4% | -3.1% | -5.4% |
| France | 2.4% | 0.7% | 1.4% | -0.3% | -2.3% | -2.7% |
| Germany | 0.0% | 2.9% | 1.8% | -2.4% | -4.8% | -5.8% |
| Greece | -3.1% | -1.9% | -1.2% | -2.6% | -2.5% | -1.9% |
| Italy | -0.9% | 2.6% | -1.9% | -2.8% | -4.6% | -5.9% |
| Netherlands | 1.0% | 2.1% | -4.2% | -2.6% | -4.0% | -5.2% |
| EMU | 0.4% | 1.7% | -0.5% | -2.1% | -4.0% | -4.8% |
| Memo:US | 5.7% | 2.2% | -0.7% | 0.1% | -2.6% | -3.8% |
| Memo:UK | 0.4% | 1.7% | -0.5% | -2.1% | -4.0% | -4.8% |
by Tom Moeller February 12, 2010
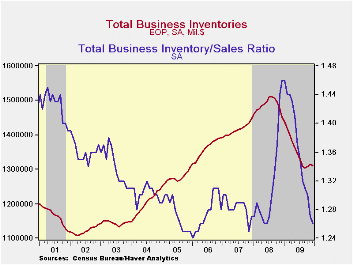 A
developing
trend towards accumulation of business inventories was cut short in
December. The 0.2% yearend decline partially reversed gains during the
prior two months which were the first in over a year. For the year
business inventories fell a record 9.7% as prices and volumes declined.
Perhaps the earlier accumulation resulted from slower sales growth.
Business sales in December were below the pace during three of the
prior four months. As a result, the inventory/sales ratio fell back to
the cycle low of 1.26 from a January '09 high of 1.46.
A
developing
trend towards accumulation of business inventories was cut short in
December. The 0.2% yearend decline partially reversed gains during the
prior two months which were the first in over a year. For the year
business inventories fell a record 9.7% as prices and volumes declined.
Perhaps the earlier accumulation resulted from slower sales growth.
Business sales in December were below the pace during three of the
prior four months. As a result, the inventory/sales ratio fell back to
the cycle low of 1.26 from a January '09 high of 1.46.
Lower
manufacturing and wholesale inventories led the December decline after
earlier gains which, in the case of wholesalers, was led by higher
 petroleum
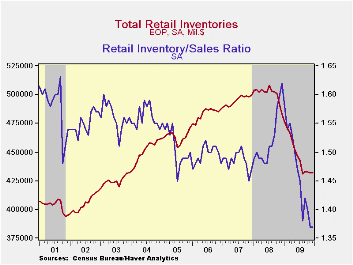
prices. Total retail inventories were unchanged
after steady declines since August 2008. Cuts last month were led by
food & beverage stores with a 1.5% (-0.6% y/y) decline.
Elsewhere, inventory cutting slowed from earlier strong declines.
Furniture inventories even have risen during three of the last four
months while clothing and general merchandise inventories are falling
at slower rates. Auto dealer inventories slipped m/m and are down by
one-quarter y/y.
petroleum
prices. Total retail inventories were unchanged
after steady declines since August 2008. Cuts last month were led by
food & beverage stores with a 1.5% (-0.6% y/y) decline.
Elsewhere, inventory cutting slowed from earlier strong declines.
Furniture inventories even have risen during three of the last four
months while clothing and general merchandise inventories are falling
at slower rates. Auto dealer inventories slipped m/m and are down by
one-quarter y/y.
Retailers' inventory/sales ratio fell to a new cycle low with sales gains and little inventory growth. The I/S ratio for department stores led the decline with little increase elsewhere. Wholesalers' ratio also fell to a near-record low while the I/S ratio in the factory sector fell to the lowest level since July 2008.
The business sales and inventory data are available in Haver's USECON database.
| Business Inventories (%) | December | November | October | Y/Y | 2009 | 2008 | 2007 |
|---|---|---|---|---|---|---|---|
| Total | -0.2 | 0.5 | 0.3 | -9.7 | -9.7 | 0.4 | 4.0 |
| Retail | 0.0 | -0.2 | -0.0 | -10.6 | -10.6 | -3.3 | 2.5 |
| Retail excl. Auto | 0.2 | -0.3 | -0.2 | -5.1 | -5.1 | -1.9 | 2.7 |
| Wholesale | -0.8 | 1.6 | 0.6 | -10.2 | -10.2 | 2.5 | 6.2 |
| Manufacturing | -0.1 | 0.2 | 0.4 | -8.6 | -8.6 | 2.2 | 3.7 |
by Tom Moeller February 12, 2010
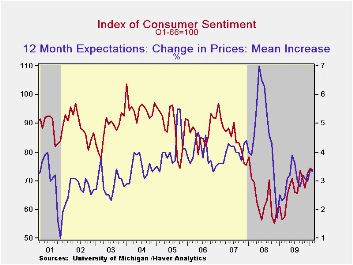 The
Reuters/University of Michigan Index of Consumer Sentiment for
mid-February fell modestly to 73.7 from is two-year high of to 74.4
reached last month. The latest figure fell short of Consensus
expectations for a higher reading of 75.0; however, it compares
favorably to the low of 55.3 in November 2008. During the last ten
years there has been a two-thirds correlation between the level of
sentiment and the three-month change real consumer spending.
The
Reuters/University of Michigan Index of Consumer Sentiment for
mid-February fell modestly to 73.7 from is two-year high of to 74.4
reached last month. The latest figure fell short of Consensus
expectations for a higher reading of 75.0; however, it compares
favorably to the low of 55.3 in November 2008. During the last ten
years there has been a two-thirds correlation between the level of
sentiment and the three-month change real consumer spending.
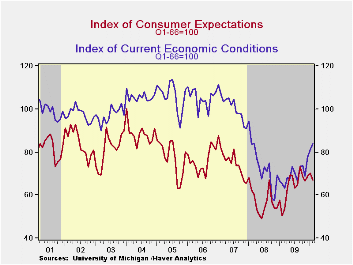
Expected economic conditions accounted for the decline with a 4.6% m/m drop to the lowest level since November. Expectations for business conditions during the next year and during the next five years fell moderately but expectations for personal finances fell to the lowest level in twelve months.
Sentiment about current economic conditions increased by another 3.7% to its highest level since March 2008. Assessments of current financial conditions were unchanged m/m at their highest since September of 2008. Buying conditions for large household goods, including furniture, refrigerators, stoves & televisions, also moved up another 5.3% to the highest level since January 2008.
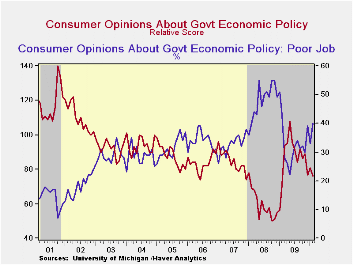
Expected price inflation during the next year slipped m/m to 3.3% but it was up from the December 2008 reading of 1.7%. Respondents' view of government policy, which may eventually influence economic expectations, slipped. Just sixteen percent of respondents thought that a good job was being done by government versus 40% who thought a poor job was being done, a twelve-month high.
The Reuters/University of Michigan survey data are not seasonally adjusted. The reading is based on telephone interviews with about 500 households at month-end. These results are based on about 320 interviews. The summary indexes are in Haver's USECON database with details in the proprietary UMSCA database.
| University of Michigan | Mid-February | January | December | Feb. y/y | 2009 | 2008 | 2007 |
|---|---|---|---|---|---|---|---|
| Consumer Sentiment | 73.7 | 74.4 | 72.5 | 30.9% | 66.3 | 63.8 | 85.6 |
| Current Conditions | 84.1 | 81.1 | 78.0 | 28.4 | 69.6 | 73.7 | 101.2 |
| Expectations | 66.9 | 70.1 | 68.9 | 32.5 | 64.1 | 57.3 | 75.6 |

Tom Moeller
AuthorMore in Author Profile »Prior to joining Haver Analytics in 2000, Mr. Moeller worked as the Economist at Chancellor Capital Management from 1985 to 1999. There, he developed comprehensive economic forecasts and interpreted economic data for equity and fixed income portfolio managers. Also at Chancellor, Mr. Moeller worked as an equity analyst and was responsible for researching and rating companies in the economically sensitive automobile and housing industries for investment in Chancellor’s equity portfolio. Prior to joining Chancellor, Mr. Moeller was an Economist at Citibank from 1979 to 1984. He also analyzed pricing behavior in the metals industry for the Council on Wage and Price Stability in Washington, D.C. In 1999, Mr. Moeller received the award for most accurate forecast from the Forecasters' Club of New York. From 1990 to 1992 he was President of the New York Association for Business Economists. Mr. Moeller earned an M.B.A. in Finance from Fordham University, where he graduated in 1987. He holds a Bachelor of Arts in Economics from George Washington University.
More Economy in Brief


