 Global| Mar 14 2006
U.S. Retail Sales Off, But ...
by:Tom Moeller
|in:Economy in Brief
Summary
US retail sales fell 1.3% last month but several factors suggest the decline hardly indicates consumer spending weakness, even though it exceeded Consensus expectations for a 0.8% drop. 1) January's warm weather surge in spending was [...]
US retail sales fell 1.3% last month but several factors suggest the decline hardly indicates consumer spending weakness, even though it exceeded Consensus expectations for a 0.8% drop. 1) January's warm weather surge in spending was revised higher to 2.9%. 2) Retail sales during January and February were 2.8% above 4Q05. 3) The 0.4% decline in nonauto sales was less than Consensus expectations for a 0.5% drop.
Lower nonauto retail sales followed a January surge revised up to 2.6% and the two month strength in sales left the 1Q average so far 2.3% above 4Q which rose 1.9% from 3Q.
Motor vehicle & parts dealers sales fell 4.6% (-0.9% y/y) after an upwardly revised 4.2% January spurt. The decline was in line with the 5.8% m/m drop in unit auto sales during February.
Lower apparel store sales reflected the brunt of the warm-weather give back from January strength. A 3.3% (+1.6% y/y) drop followed the downwardly revised 2.4% gain. Elsewhere, discretionary spending looked respectable. General merchandise store sales slipped just 0.3% (5.3% y/y) after a little revised 1.8% January rise. Sales of furniture, electronics & appliances fell 3.1% (+5.6% y/y) after a 5.6% January spurt that was much stronger than the 2.9% gain reported initially.
Building material sales rose another 1.5% (20.5% y/y) after a 7.3% jump in January that was double the rise initially estimated.
Sales at gasoline stations fell 1.6% (+17.7% y/y) as retail gasoline prices fell 1.5%. In March, gasoline prices at $2.35 per gallon are 3.0% higher than during February.
Less gasoline, nonauto retail sales fell 0.3% (+7.8% y/y) last month following a 2.4% January spike that revised up from 1.8% reported initially.
Sales of nonstore retailers (internet & catalogue) surged 3.2% (13.3% y/y) after a little revised 2.7% January decline.
| Feb | Jan | Y/Y | 2005 | 2004 | 2003 | |
|---|---|---|---|---|---|---|
| Retail Sales & Food Services | -1.3% | 2.9% | 6.7% | 7.5% | 7.3% | 4.3% |
| Excluding Autos | -0.4% | 2.6% | 8.9% | 8.6% | 8.2% | 4.7% |
by Tom Moeller March 14, 2006
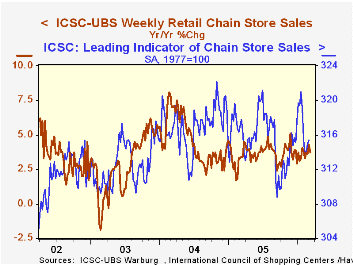
Chain store sales inched 0.1% higher last week following a 0.2% gain the prior period, according to the International Council of Shopping Centers (ICSC)-UBS survey.
Because of a 1.5% jump late last month, the latest increase lifted the average level of sales so far in March 1.4% above the February average which rose 1.1% from January.
During the last ten years there has been a 47% correlation between the y/y change in chain store sales and the change in nonauto retail sales less gasoline.
The leading indicator of chain store sales rose 0.2% in early March for the third straight w/w increase.The ICSC-UBS retail chain-store sales index is constructed using the same-store sales (stores open for one year) reported by 78 stores of seven retailers: Dayton Hudson, Federated, Kmart, May, J.C. Penney, Sears and Wal-Mart.
| ICSC-UBS (SA, 1977=100) | 03/11/06 | 03/04/06 | Y/Y | 2005 | 2004 | 2003 |
|---|---|---|---|---|---|---|
| Total Weekly Chain Store Sales | 470.5 | 470.1 | 3.7% | 3.6% | 4.7% | 2.9% |
by Tom Moeller March 14, 2006
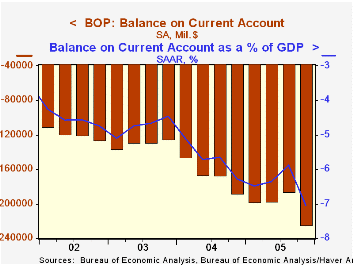
The US current account deficit surged last quarter to $224.9B from the revised 3Q deficit $185.4B. Last year, the current account deficit of $804.9B jumped $136.9B from 2004 to a new record and equaled 6.4% of GDP.
Consensus expectations had been for a 4Q deficit of $220.0B.
The deficit in merchandise trade deteriorated to a record $212.4B from $197.3B in 3Q. Exports jumped 2.9% (10.7% y/y) in a recovery from the modest 0.8% 3Q increase which was restrained by the damage to Gulf Coast port facilities caused by Hurricane Katrina. 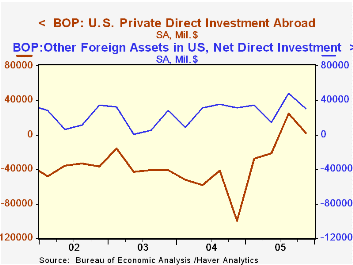
Imports surged 5.1% (13.5% y/y) as petroleum imports rose another 9.1% (37.1% y/y). Imports of non-petroleum products were, however, also strong and rose 4.4% (9.7% y/y).
The surplus on services fell slightly to $15.1B from an upwardly revised $15.9B surplus during 3Q. Exports of services grew 0.6% (7.5% y/y) and 10.4% for the full year. Imports grew 1.7% q/q (6.1% y/y).
From the capital account, net US foreign direct investment abroad was positive for the second consecutive quarter and foreign assets in the US fell from the 3Q high.
| US Int'l Balance of Payments | 4Q '05 | 3Q '05 | Y/Y | 2005 | 2004 | 2003 |
|---|---|---|---|---|---|---|
| Current Account Deficit | $224.9B | $185.4B | $188.4B (4Q04) | $804.9B | $668.1B | $519.7B |
| Goods/Services/Income Deficit | $199.8B | $176.5B | $166.0B | $722.1B | $587.1B | $448.5B |
| Exports | 3.6% | 3.2% | 13.1% | 13.7% | 14.9% | 6.8% |
| Imports | 6.4% | 2.7% | 15.2% | 16.3% | 18.1% | 7.3% |
| Unilateral Transfers Deficit | $25.1BB | $9.0B | $22.4B | $82.9B | $80.9B | $71.2B |
by Tom Moeller Mach 14, 2006
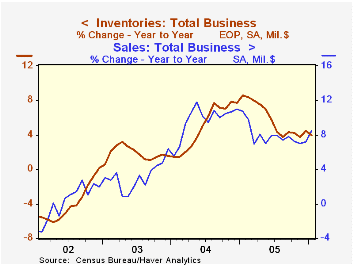
Though the rate of gain halved, total business inventories rose 0.4% during January following an upwardly revised 0.8% December gain. The Consensus expectation had been for a 0.3% increase.
From the GDP accounts, nonfarm inventories contributed a hefty 1.6 percentage points to economic growth last quarter due to production increases necessary to keep the rate of inventory accumulation steady in the face of strong sales.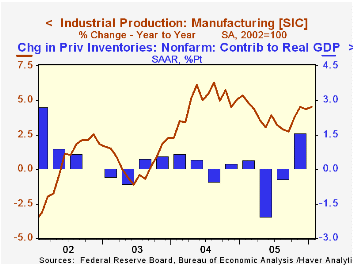
Retail inventories increased 0.5% following an upwardly revised 0.8% rise during December. Motor vehicle inventories rose 0.6% (1.0% y/y) following five months of between 1% and 2% accumulation. Retail inventories less autos rose 0.5% (4.3% y/y) due to a 0.8% (4.7% y/y) gain in furniture. Apparel inventories fell 0.5% (+3.0% y/y) after a 0.3% December gain that was half the rise initially reported and general merchandise inventories also fell by 0.1% (+3.6% y/y) after two months of 0.4% increase.
Wholesale inventories rose just 0.1%. Durables rose 0.3% (5.9% y/y) but nondurables fell 0.1% (+5.3% y/y). During the last ten years there has been a 67% correlation between the y/y change in wholesale inventories and the change in imports of nonpetroleum goods.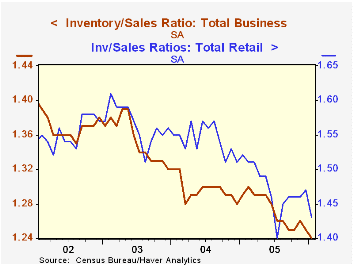
Factory sector inventories rose 0.5% after an upwardly revised 0.6% gain during December.
The inventory to sales ratio for total business fell to a new low of 1.24 as the 1.3% (8.5% y/y) rise in business sales outpaced the gain in inventories.
Monetary Policy Shocks, Inventory Dynamics, and Price-setting Behavior from the Federal Reserve Bank of San Francisco can be found here.
Durable Goods Inventories and the Volatility of Production: Explaining the Less volatile U.S. Economy from the Federal Reserve Bank of St. Louis is available here.
| Business Inventories | Jan | Dec | Y/Y | 2005 | 2004 | 2003 |
|---|---|---|---|---|---|---|
| Total | 0.4% | 0.8% | 4.0% | 4.4% | 7.7% | 1.5% |
| Retail | 0.5% | 0.8% | 3.2% | 2.8% | 5.5% | 3.9% |
| Retail excl. Autos | 0.5% | 0.7% | 4.3% | 4.5% | 5.9% | 2.0% |
| Wholesale | 0.1% | 0.9% | 5.7% | 6.7% | 10.8% | 2.0% |
| Manufacturing | 0.5% | 0.6% | 3.5% | 4.4% | 7.7% | -1.1% |
by Tom Moeller March 14, 2006
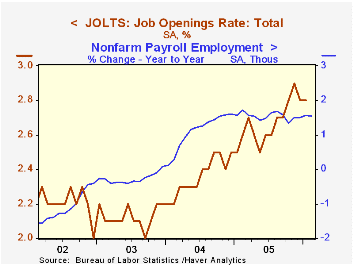
The Bureau of Labor Statistics reported that the job openings rate, from the Job Openings & Labor Turnover Survey (JOLTS), was unchanged from a downwardly revised 2.8% in December. The job openings rate is the number of job openings on the last business day of the month as a percent of total employment plus job openings.
The actual number of job openings fell for the second month to 3.916 million (17.3% y/y).
The hires rate also was steady m/m but the December level was revised up to 3.5%. The hires rate is the number of hires during the month divided by employment. The hires level during December fell 134,000 (-2.8% y/y) to 4.507 million.
The job separations rate was steady at a low 3.2%. Separations include quits, layoffs, discharges, and other separations as well as retirements. The total separations, or turnover, rate is the total number of separations during the month divided by employment. The level of job separations fell 182,000 (-6.8% y/y) to 4.133 million.
The survey dates only to December 2000 but has since followed the movement in nonfarm payrolls.
A description of the Jolts survey and the latest release from the U.S. Department of Labor is available here.
Jobless Recoveries and the Wait-and-See Hypothesis from the Federal Reserve Bank of Kansas city is available here.
| JOLTS (Job Openings & Labor Turnover Survey) | Jan | Dec | Jan '05 | 2005 | 2004 | 2003 |
|---|---|---|---|---|---|---|
| Job Openings Rate: Total | 2.8% | 2.8% | 2.5% | 2.7% | 2.4% | 2.1% |
| Hires Rate: Total | 3.5% | 3.5% | 3.7% | 3.6% | 3.5% | 3.2% |
by Louise Curley March 14, 2006
The role of industrial production in most highly developed economies has declined in importance as the role of services has loomed larger. Nevertheless, industrial production still represents a significant portion of these economies and its monthly measurement can be a useful early indicator of total economic activity.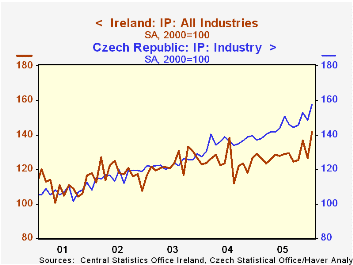
Several Continental European countries have reported Industrial Production indexes for January over the past week. The picture is mixed. The year-to-year percentage increases range from a minimal increase of 0.10% for France to a 15.27% increase for the Czech Republic. More important than one month changes, however, are the underlying trends.
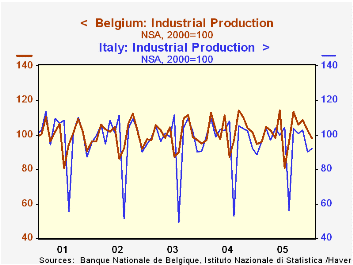
Industrial production in France, Italy, Belgium, Spain and Greece has shown little evidence of a trend either up or down over the past five years. The indexes for these countries in recent months are little different from the base of 100 established in 2000. As an example of these trends, industrial production indexes for Belgium and Italy are shown in the first chart.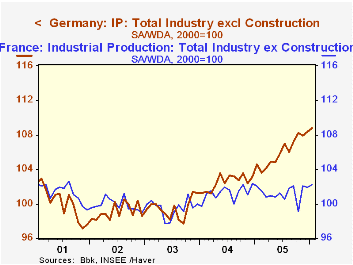
In sharp contrast to the experience of these countries, the trends in industrial production in Ireland and the Czech Republic have been significantly upwards as shown in the second chart. More important than these, relatively small economies, is the improvement in industrial production in Germany where production is now some 11% higher than the low point of 97.7 (2000=100) reached in September, 2003. Germany is the only major continental country where Industrial production has shown even a modest upward trend. The third chart contrasts German Industrial Production with that of France.
| Industrial Production Indexes (2000=100) | Jan 06 | Dec 05 | Jan 05 | Y/Y % | 2005 | 2004 | 2003 |
|---|---|---|---|---|---|---|---|
| Germany (SAWDA) | 108.8 | 108.4 | 104.6 | 4.02 | 106.0 | 102.5 | 99.5 |
| France (SAWDA) | 102.2 | 101.9 | 102.1 | 0.10 | 101.2 | 101.3 | 99.5 |
| Italy (NAS) | 92.1 | 90.1 | 88.5 | 4.07 | 95.5 | 97.3 | 96.8 |
| Belgium (NAS) | 97.7 | 102.7 | 94.6 | 3.28 | 101.4 | 102.6 | 100.0 |
| Greece (NAS) | 89.1 | 95.3 | 87.8 | 1.48 | 99.3 | 100.5 | 99.3 |
| Spain (NAS) | 101.9 | 96.7 | 96.8 | 5.27 | 102.4 | 102.3 | 100.5 |
| Ireland (SA) | 141.6 | 126.7 | 128.8 | 9.94 | 127.6 | 123.9 | 123.5 |
| Czech Republic (SA) | 157.8 | 148.4 | 136.9 | 15.27 | 144.1 | 135.6 | 123.4 |

Tom Moeller
AuthorMore in Author Profile »Prior to joining Haver Analytics in 2000, Mr. Moeller worked as the Economist at Chancellor Capital Management from 1985 to 1999. There, he developed comprehensive economic forecasts and interpreted economic data for equity and fixed income portfolio managers. Also at Chancellor, Mr. Moeller worked as an equity analyst and was responsible for researching and rating companies in the economically sensitive automobile and housing industries for investment in Chancellor’s equity portfolio. Prior to joining Chancellor, Mr. Moeller was an Economist at Citibank from 1979 to 1984. He also analyzed pricing behavior in the metals industry for the Council on Wage and Price Stability in Washington, D.C. In 1999, Mr. Moeller received the award for most accurate forecast from the Forecasters' Club of New York. From 1990 to 1992 he was President of the New York Association for Business Economists. Mr. Moeller earned an M.B.A. in Finance from Fordham University, where he graduated in 1987. He holds a Bachelor of Arts in Economics from George Washington University.
More Economy in Brief


