 Global| Jul 14 2006
U.S. Retail Sales Lower Due To Weakness in Autos & Housing
by:Tom Moeller
|in:Economy in Brief
Summary
US retail sales fell 0.1% last month following an unrevised 0.1% up tick during May. It was the first m/m decline since February and it resulted in a 3.7% (AR) increase for 2Q after the 13.4% jump the prior quarter. Consensus [...]
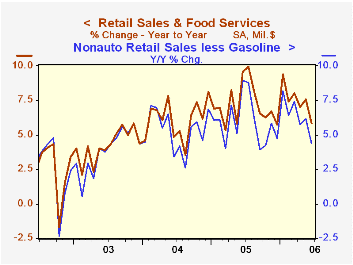
US retail sales fell 0.1% last month following an unrevised 0.1% up tick during May. It was the first m/m decline since February and it resulted in a 3.7% (AR) increase for 2Q after the 13.4% jump the prior quarter. Consensus expectations had been for a 0.4% increase in sales last month.
Nonauto retail sales increased an expected 0.3% but the rise during May was revised up to 0.7%. Nonauto retail spending grew 6.6% (AR) last quarter after an 11.4% rise during 1Q.
Lower sales by motor vehicle & parts dealers led last month's sales decline. A 1.4% drop (-3.5% y/y) was the third m/m decline this year despite a 1.3% rise in June unit auto sales to 16.30M.
Building material sales fell further in June. The 1.0% (+8.8% y/y) m/m decline was the third in a row and the fifth in the last seven months.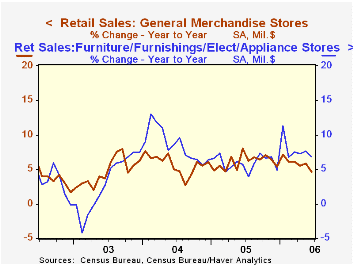
Sales at gasoline stations increased another 1.1% (20.4% y/y) even though retail gasoline prices fell 0.8% m/m during June to an average of $2.89 per gallon. Gas prices have since jumped to $2.97.
Less gasoline, nonauto retail sales rose 0.1% (7.0% y/y) after a 0.6% May increase that was double the rise estimated initially. During 2Q, nonauto retail sales less gasoline increased 3.3% (AR) after a 12.2% spurt during 1Q.
Sales of discretionary items were firm last month. Sales of furniture, electronics & appliances increased 0.4% (6.8% y/y) after a 0.3% gain during May which was initially estimated as a 0.1% decline. General merchandise stores rose 0.3% (4.6% y/y) after an unrevised like gain during May and apparel store sales also rose 0.3% (4.9% y/y) though the prior month's increase was doubled to 0.4%. Sales of nonstore retailers (internet & catalogue) slipped 0.3% (12.3% y/y) after an upwardly revised 3.0% May spike.
| June | May | Y/Y | 2005 | 2004 | 2003 | |
|---|---|---|---|---|---|---|
| Retail Sales & Food Services | -0.1% | 0.1% | 5.9% | 7.2% | 6.2% | 4.2% |
| Excluding Autos | 0.3% | 0.7% | 8.5% | 8.2% | 7.2% | 4.7% |
by Tom Moeller July 14, 2006
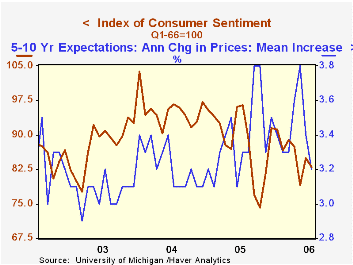
Consumer sentiment early this month reversed part of its June improvement and sagged 2.2% to 83.0, according to the University of Michigan. The decline ran counter to Consensus expectations for a modest increase to 85.5.
During the last ten years there has been a 77% correlation between the level of consumer sentiment and the y/y change in real consumer spending.
The reading of current economic conditions reversed about half of the June increase with a 4.0% decline. The index of current personal finances reversed nearly all of the prior month's rise with an 8.0% (-14.8% y/y) decline though buying conditions for large household goods fell a modest 1.3% (-8.7% y/y).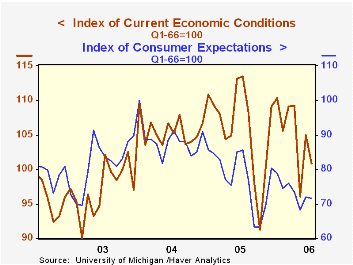
Expectations for the economy fell a modest 0.6% but it was the fifth decline his year. It was led by a 5.7% (-25.9% y/y) decline in 12 month expected business conditions although 5 year expected conditions improved modestly, the first gain in four months, as did expected personal finances.
Consumers' opinion about gov't economic policy recovered 5.4% m/m (-15.2% y/y), the first monthly increase since March while expected inflation during the next year fell sharply to 3.7%, its lowest since February. The five to ten year expected rate of inflation also fell to 3.2%, its lowest in over a year.
The University of Michigan survey is not seasonally adjusted.The mid-month survey is based on telephone interviews with 250 households nationwide on personal finances and business and buying conditions. The survey is expanded to a total of 500 interviews at month end.
| University of Michigan | July (Prelim.) | June | Y/Y | 2005 | 2004 | 2003 |
|---|---|---|---|---|---|---|
| Consumer Sentiment | 83.0 | 84.9 | -14.0% | 88.6 | 95.2 | 87.6 |
| Current Conditions | 100.8 | 105.0 | -11.2% | 105.9 | 105.6 | 97.2 |
| Expectations | 71.6 | 72.0 | -16.3% | 77.4 | 88.5 | 81.4 |
by Tom Moeller July 14, 2006
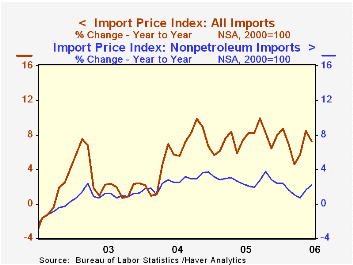
Total import prices rose just 0.1% last month after a 1.7% surge during May and about matched Consensus expectations for a 0.2% advance.
Lower petroleum prices held back the increase with a 1.4% decline. That likely will not be repeated in July given that Brent crude oil prices this month have ranged between $72 and $76 per barrel versus a June average of $68.56.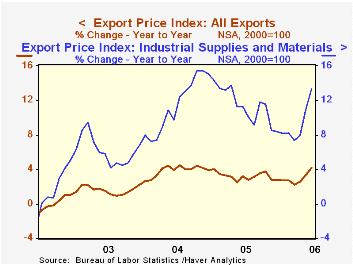
Import prices less petroleum rose 0.4% after an upwardly revised 0.7% May increase. The rise was led by a 1.1% (11.2% y/y) increase in nonoil industrial supplies such as a 9.3% (66.4% y/y) spike in nonferrous metals prices.
Capital goods prices rose 0.3% (-1.1% y/y) but excluding computers, capital goods prices rose 0.5% (1.2% y/y). Prices for nonauto consumer goods inched up 0.1% for the second consecutive month (-0.1% y/y).
During the last ten years there has been a 66% (negative) correlation between the nominal trade-weighted exchange value of the US dollar vs. major currencies and the y/y change in non oil import prices. The correlation is a lower 47% against a broader basket of currencies and a lower 57% against the real value of the dollar.
Export prices rose a firm 0.8% led by a 1.8% gain in industrial supplies (13.3% y/y) prices.
| Import/Export Prices (NSA) | June | May | Y/Y | 2005 | 2004 | 2003 |
|---|---|---|---|---|---|---|
| Import - All Commodities | 0.1% | 1.7% | 7.2% | 7.5% | 5.6% | 2.9% |
| Petroleum | -1.4% | 6.1% | 32.6% | 37.6% | 30.5% | 21.0% |
| Non-petroleum | 0.4% | 0.7% | 2.2% | 2.7% | 2.6% | 1.1% |
| Export - All Commodities | 0.8% | 0.6% | 4.2% | 3.2% | 3.9% | 1.6% |
by Tom Moeller July 14, 2006
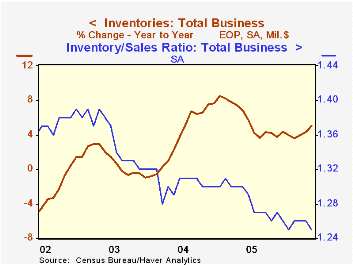
Total business inventories increased 0.8% during May, about matched the prior month's strong gain and easily surpassed Consensus expectations for a 0.4% rise.
Retail inventories jumped 1.6% after a slight slip during April. Motor vehicle inventories surged 3.2% (4.1% y/y) while less autos, retail inventories rose a strong 0.8% led by a 1.1% (6.3% y/y) jump in apparel. General merchandise inventories firmed 0.7% (-0.7% y/y) but furniture inventories rose just 0.2% (5.2% y/y).
Wholesale inventories jumped 0.8% as petroleum inventories surged 7.1% (35.9% y/y). Durables rose 0.8% (8.7% y/y). During the last ten years there has been a 67% correlation between the y/y change in wholesale inventories and the change in imports of nonpetroleum goods.
Factory sector inventories slipped modestly after a 1.0% April spike.
The inventory to sales ratio for total business slipped back to its low 1.25 as business sales jumped 1.4% (8.8% y/y).
| Business Inventories | May | April | Y/Y | 2005 | 2004 | 2003 |
|---|---|---|---|---|---|---|
| Total | 0.8% | 0.7% | 5.1% | 4.4% | 7.6% | -1.0% |
| Retail | 1.6% | -0.1% | 4.1% | 2.7% | 6.7% | 3.8% |
| Retail excl. Autos | 0.8% | 0.2% | 4.2% | 4.5% | 7.1% | 1.9% |
| Wholesale | 0.8% | 1.3% | 7.8% | 7.1% | 9.8% | 1.8% |
| Manufacturing | -0.0% | 1.0% | 3.9% | 4.0% | 6.9% | -7.4% |
by Tom Moeller July 14, 2006
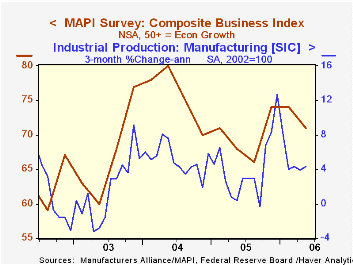
The 2Q '06 Composite Business Index published by the Manufacturers' Alliance/MAPI fell moderately to 71 from 74 the prior quarter. The figure, however, was higher than the year earlier level and so far in 2006 the average reading of 73 compared favorably to last year's average of 70.
During the last ten years there has been a 69% correlation between the Composite Index Level and quarterly growth in US factory sector output.
The current orders index fell to 81 from 85 in 1Q and the average this year equaled that for all of last year. Since early 2004 the orders index has trended lower from a high of 93.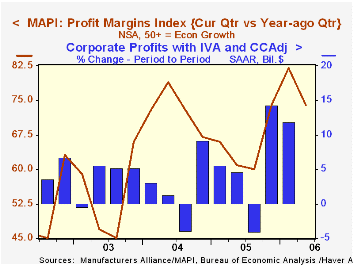
The 2Q export orders index fell to 72 from 78 in 1Q and from 74 averaged in 2004 & 2005. During the last ten years there has been a 59% correlation between the export orders index and quarterly growth in real US exports.
The profit margins index fell sharply to 74 from 82 in 1Q. Both figures were up sharply from the 2005 average of 65.Capital spending intentions for the coming year moved higher q/q with the index at a record high of 86. During the last ten years there has been a 75% correlation between the capital spending index a q/q growth in business investment.
The survey of 60 senior financial executives representing a broad range of manufacturing industries reflects the views on current & future business conditions. The business outlook index is a weighted sum of shipments, backlogs, inventories, and profit margin indexes.
For the latest US Business Outlook from the MAPI click here.
| Manufacturers' Alliance/MAPI Survey | 2Q '06 | 1Q '06 | 2Q '05 | 2005 | 2004 | 2003 |
|---|---|---|---|---|---|---|
| Composite Business Index | 71 | 74 | 68 | 70 | 76 | 67 |
by Carol Stone July 14, 2006
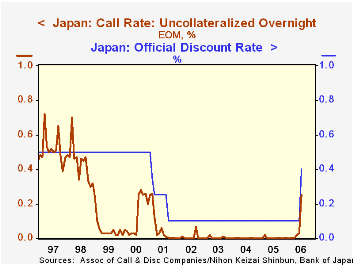
The Bank of Japan announced a policy change today (Friday). The best way to describe it is to quote the Bank's own text:"At the Monetary Policy Meeting held today, the Bank of Japan decided, by a unanimous vote, to change the guideline for money market operations for the intermeeting period, effective immediately from the announcement of the decision. "The Bank of Japan will encourage the uncollateralized overnight call rate to remain at around 0.25 percent." This reflects basically a 25-basis-point increase in that key money market interest rate. The Bank also raised its discount rate from 0.1% to 0.4%. This rate covers bank borrowing directly from the Bank of Japan under its lending facility; at the same time, waivers of extra fees -- "add-on rates" -- will continue for frequent users of the facility, so the Bank is not trying to discourage its use. The Bank will also continue buying long-term Japanese government bonds in an attempt to restrain any general rise in long-term interest rates.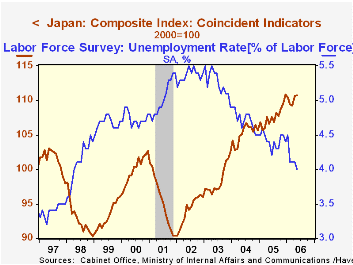
This is the first increase in the BoJ's basic rate structure since July 2000, when the call rate was also raised from near zero to 0.25%. The strength of the Japanese economy was fairly tenuous then, though, and this hike was reversed in March 2001. Now, in contrast, the BoJ believes that "Japan's economy continues to expand moderately, with domestic and external demand and also the corporate and household sectors well in balance. The economy is likely to expand for a sustained period." Moreover, "the year-on-year rate of change in consumer prices is projected to continue to follow a positive trend."
The Bank remains somewhat skeptical, however, and concludes its announcement with the assessment that it expects to "adjust the level of the policy interest rate gradually . . . In this process, an accommodative monetary environment ensuing from very low interest rates will probably be maintained for some time."
The moderate language of the statement and the implication that further rate increases would come only slowly was milder than some market participants were anticipating, apparently, and they actually traded the yen downward on the day. The stock market fell as well, but this may be related to declines in other world markets that are in response to the violence in the Middle East and the accompanying pressure on oil prices.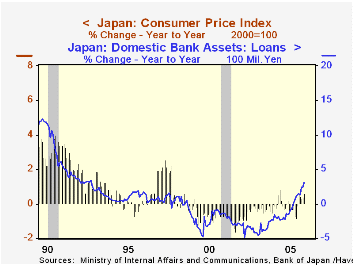
We'd probably agree with the BoJ, though, in their cautious attitude. Just on Tuesday, Louise Curley discussed "wavering" consumer sentiment in the country and on June 30, we expressed some discomfort of our own with evident hesitation in labor markets. These caveats notwithstanding, the Japanese economy is in the best condition it has seen in a good many years. The second graph here illustrates this with the Cabinet Office's index of coincident indicators and the unemployment rate. Two other conditions have changed over the past several months. Bank lending has begun to grow again. In the third graph, we see the nice uptrend developing in loans at domestic banks. At the time of the last BoJ rate hike in 2000, the banks were still under pressure from distressed loans and their loan portfolios were contracting, a process that continued until June of last year. Additionally, prices are rising, with positive year-on-year changes in the CPI now for five consecutive months. As Louise noted in her discussion Tuesday, people are now concerned that there might be more inflation than they want!
Tom Moeller
AuthorMore in Author Profile »Prior to joining Haver Analytics in 2000, Mr. Moeller worked as the Economist at Chancellor Capital Management from 1985 to 1999. There, he developed comprehensive economic forecasts and interpreted economic data for equity and fixed income portfolio managers. Also at Chancellor, Mr. Moeller worked as an equity analyst and was responsible for researching and rating companies in the economically sensitive automobile and housing industries for investment in Chancellor’s equity portfolio. Prior to joining Chancellor, Mr. Moeller was an Economist at Citibank from 1979 to 1984. He also analyzed pricing behavior in the metals industry for the Council on Wage and Price Stability in Washington, D.C. In 1999, Mr. Moeller received the award for most accurate forecast from the Forecasters' Club of New York. From 1990 to 1992 he was President of the New York Association for Business Economists. Mr. Moeller earned an M.B.A. in Finance from Fordham University, where he graduated in 1987. He holds a Bachelor of Arts in Economics from George Washington University.
More Economy in Brief
 Global| Feb 05 2026
Charts of the Week: Balanced Policy, Resilient Data and AI Narratives
by:Andrew Cates


