 Global| May 12 2005
U.S. Retail Sales Jump
by:Tom Moeller
|in:Economy in Brief
Summary
US retail sales jumped 1.4% last month following an upwardly revised 0.4% gain in March. Consensus expectations had been for a 0.7% April increase. Excluding motor vehicles sales rose 1.1%, also twice the Consensus expectation.That [...]
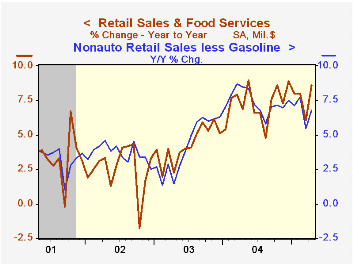
US retail sales jumped 1.4% last month following an upwardly revised 0.4% gain in March. Consensus expectations had been for a 0.7% April increase.
Excluding motor vehicles sales rose 1.1%, also twice the Consensus expectation.That followed a 0.2% March gain revised up slightly from the initial estimate of 0.1%. Nonauto retail sales less gasoline in April rose 1.0% (6.8% y/y) following a slight decline in March. Gasoline service station sales surged 1.9% (19.8% y/y).
A 1.2% (7.4% y/y) rise in building material store sales led last month's rise in spending, for the second month.
Spending on discretionary items was mixed. General merchandise store sales surged 1.5% (7.4% y/y) after falling 0.7% in March and apparel store sales recovered 2.8% (7.9% y/y) following the prior month's 2.2% decline. Furniture and electronics sales, however, fell slightly (+4.1% y/y) for the second consecutive month.
Sales of nonstore retailers (internet and catalogue) rose 0.4% (12.4% y/y) following a 1.8% March jump.
| April | March | Y/Y | 2004 | 2003 | 2002 | |
|---|---|---|---|---|---|---|
| Retail Sales & Food Services | 1.4% | 0.4% | 8.6% | 7.3% | 4.3% | 2.5% |
| Excluding Autos | 1.1% | 0.2% | 8.1% | 8.3% | 4.7% | 3.3% |
by Tom Moeller May 12, 2005
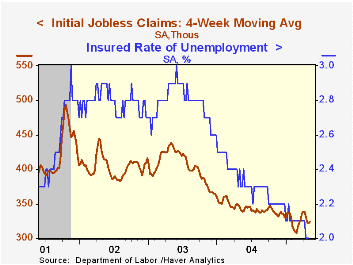
For the third consecutive week, initial claims for unemployment insurance rose. The 4,000 increase to 340,000 was smaller than the gains during the earlier two weeks (the prior week's gain was revised slightly higher), but the latest level was 4.3% above the April average. Consensus expectations had been for 329,000 claims.
During the last ten years there has been a (negative) 75% correlation between the level of initial claims for unemployment insurance and the monthly change in payroll employment. There has been a (negative) 65% correlation with the level of continuing claims.
The four week moving average of initial claims rose to 324,000 (-4.8% y/y).
Continuing claims for unemployment insurance rose 15,000 and the prior week's gain was revised down slightly.
The insured unemployment rate held at 2.0% for the third consecutive weeks.
Self-employed immigrants: An analysis of recent data from the Federal Reserve Bank of Chicago can be found here.
| Unemployment Insurance (000s) | 05/07/05 | 04/30/05 | Y/Y | 2004 | 2003 | 2002 |
|---|---|---|---|---|---|---|
| Initial Claims | 340 | 336 | 1.2% | 343 | 402 | 404 |
| Continuing Claims | -- | 2,598 | -12.6% | 2,926 | 3,531 | 3,570 |
by Tom Moeller May 12, 2005
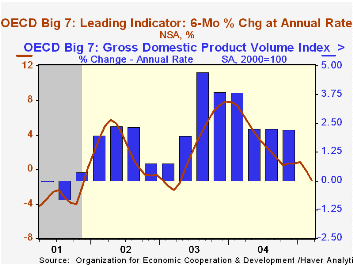
The Leading Index of the Major 7 OECD economies fell for the second month. The 0.6% decline in March followed a downwardly revised 0.5% drop in February and pulled the index's six month growth rate negative.
During the last ten years there has been a 69% correlation between the change in the leading index and the q/q change in the GDP Volume Index for the Big Seven countries in the OECD.
The leaders for the European Union (15 countries) declined for the fourth straight month and the six month growth rate of 0.1% was down from roughly 6% a year ago. The German leaders fell for the fifth month in the last six due to weaker new orders, a negative yield curve and a worsening business climate. The six month growth rate fell to a -1.7%. The French leaders fell for the fifth consecutive month and the six month growth went negative for the first time since May 2003 as new job vacancies remained depressed, share prices meandered and industrial sector prospects deteriorated. The Italian leaders dipped for the forth month in five. The six month growth rate of -0.6% remained negative as it has since last May due to a lower future tendency of orders books and of production.
The leading index for the US economy fell a hard 1.0% and six month growth went negative for the first time since April 2003. A negative yield curve and a deteriorating business climate indicator caused the decline. The leaders for Japan fell for the fourth straight month and six month growth was a negative 0.7% due to a tighter yield curve and fewer overtime hours worked.
The UK economic leaders slipped for the fifth consecutive month with six month growth solidly negative at -1.2% due to higher interest rates and weaker export prospects.The Canadian leaders have trended lower for a year and six month growth of -3.5% was the worst in two years. The yield curve is sharply inverted and housing starts are down.
The latest OECD Leading Indicator report can be found here.
| OECD | March | Feb | Y/Y | 2004 | 2003 | 2002 |
|---|---|---|---|---|---|---|
| Composite Leading Index | 101.37 | 102.00 | -0.6% | 101.99 | 97.51 | 96.33 |
| 6 Month Growth Rate | -1.3% | -0.1% | 3.6% | 2.5% | 2.3% |
by Tom Moeller May 12, 2005
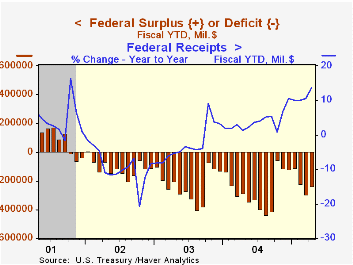
April tax revenues surged and reduced the U.S. federal government's budget deficit during the first seven months of FY 2005 by 16.5% versus the first the seven months of FY 2004.
Net receipts for the first seven months of FY05 jumped 13.7% y/y. Individual tax receipts surged 16.1% versus FY04 as April personal taxes rose 43.3% against April of last year. Corporate tax receipts continued up strongly. Reflecting the improved job market, employment taxes grew 6.0% versus 1.3% growth last year.
Growth in federal outlays remained about stable at 7.3% versus the first seven months of 2005. Growth in Medicare outlays was strong at 9.1% and social security outlays grew 5.5%. Veterans benefits grew 15.2% and defense spending slowed to 7.0% growth. Interest expense grew 11.1% with higher rates.
| US Government Finance | April | March | FY '05 - YTD | FY2004 | FY2003 | FY2002 |
|---|---|---|---|---|---|---|
| Budget Balance | $57.7B | $-71.2B | $-236.9B | $-412.1B | $-377.6B | $-157.8B |
| Net Revenues | $277.6B | $148.7B | 13.7% | 5.5% | -3.8% | -6.9% |
| Net Outlays | $219.9B | $210.0B | 7.3% | 6.1% | 7.4% | 7.9% |
by Carol Stone May 12, 2005
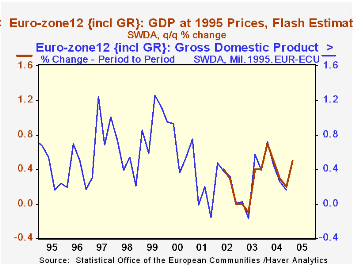
The Euro-Zone had 0.5% GDP growth in Q1, according to the Eurostat "Flash" estimate released today. This produced a year-on-year result of 1.4%, moderately weaker than any quarter since Q4 2003. In these early "Flash" figures, no details are available by type of expenditure or industry, so there's no way to tell what factors contributed to the performance.
We do, however, know something about where the developments took place. Germany experienced a nice rebound, reaching 1.0% after two quarters of virtually no growth at all. Among other Euro-Zone countries, they join the UK with its 0.6% gain in boosting Europe's economy.
Elsewhere, results were not so attractive. Italy lost 0.5% and the Netherlands, 0.1%; Belgian GDP was unchanged. Both Italy and the Netherlands GDP also decreased year-on-year.
The Netherlands reported its expenditure breakdown; private consumption edged slightly lower, and investment contracted more sharply after a good gain in Q4. Net exports decreased. The only positive input came in inventories, which grew €327 million compared to €192 million in Q4.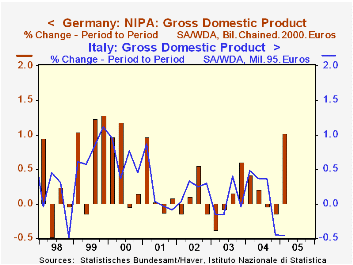
These data are mixed now by calculation methodology. As noted in the table below, "real" GDP for the overall Euro-Zone remains expressed in fixed-weights and 1995 prices; Italy's own data are also still on this basis. Germany, the UK and the Netherlands have all switched to annual chain-weighting, but Germany's reference year is 2000, the Netherlands, 1995 and the UK, 2001. Euro-Zone conventions call for all countries to switch to chain-linking by late 2006. There are also differences in the treatment of imputed charges for financial services, so-called "FISIM". These are to be reconciled for the most part by the end of this year, with a few countries in 2006. Consumption and net exports will be affected.
| GDP % Changes | 1 Qtr 2005 | 4 Qtr 2004 | Year/ Year | 2004 | 2003 | 2002 |
|---|---|---|---|---|---|---|
| Euro-Zone (fixed 1995€) | 0.5 | 0.2 | 1.4 | 1.8 | 0.5 | 0.9 |
| Germany (chain 2000€) | 1.0 | -0.1 | 0.0 | 1.6 | 0.0 | 0.2 |
| Italy (fixed 1995 €) | -0.5 | -0.4 | -0.2 | 1.0 | 0.4 | 0.4 |
| Netherlands (chain 1995€) | -0.1 | -0.0 | -0.3 | 1.4 | -0.9 | 0.6 |

Tom Moeller
AuthorMore in Author Profile »Prior to joining Haver Analytics in 2000, Mr. Moeller worked as the Economist at Chancellor Capital Management from 1985 to 1999. There, he developed comprehensive economic forecasts and interpreted economic data for equity and fixed income portfolio managers. Also at Chancellor, Mr. Moeller worked as an equity analyst and was responsible for researching and rating companies in the economically sensitive automobile and housing industries for investment in Chancellor’s equity portfolio. Prior to joining Chancellor, Mr. Moeller was an Economist at Citibank from 1979 to 1984. He also analyzed pricing behavior in the metals industry for the Council on Wage and Price Stability in Washington, D.C. In 1999, Mr. Moeller received the award for most accurate forecast from the Forecasters' Club of New York. From 1990 to 1992 he was President of the New York Association for Business Economists. Mr. Moeller earned an M.B.A. in Finance from Fordham University, where he graduated in 1987. He holds a Bachelor of Arts in Economics from George Washington University.
More Economy in Brief


