 Global| Jun 13 2006
U.S. Retail Sales Increase As Expected
by:Tom Moeller
|in:Economy in Brief
Summary
US retail sales increased an expected 0.1% following an upwardly revised 0.8% rise during April. Retail sales during the first five months of 2006 rose at a 9.2% annual rate versus the 7.2% rise during all of last year. Nonauto sales [...]
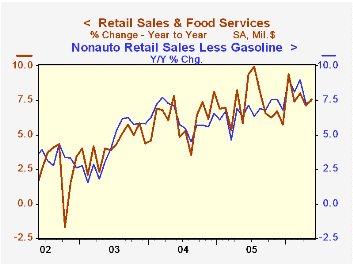
US retail sales increased an expected 0.1% following an upwardly revised 0.8% rise during April. Retail sales during the first five months of 2006 rose at a 9.2% annual rate versus the 7.2% rise during all of last year.
Nonauto sales made up some of the prior month's disappointment and rose 0.5%. The 0.8% April increase was little revised. Consensus expectations had been for a 0.5% May increase.
Sales at gasoline stations jumped another 1.9% (21.9% y/y) due to the 6.0% m/m increase in retail gasoline prices to an average of $2.91 per gallon.
Less gasoline, nonauto retail sales rose 0.3% (7.5% y/y) following a 0.1% up tick during April which was downwardly revised. Year to date, nonauto retail sales less gasoline increased 8.4% at an annual rate versus a 6.7% increase during 2005.
Sales of discretionary items were mixed last month. General merchandise stores rose 0.3% (6.0% y/y) after a 0.7% increase during April and apparel store sales rose 0.2% (6.0% y/y) after two months of 0.5% increase. Sales of nonstore retailers (internet & catalogue) jumped 1.8% (14.1% y/y) and have risen 10.8% (AR) year to date. To the downside were sales of furniture, electronics & appliances which slipped 0.1% (+6.7% y/y) due to lower furniture sales (-0.5% m/m, +7.4% y/y). Building material sales also fell 0.4% (+11.2% y/y), down for the second consecutive month.
Sales by motor vehicle & parts dealers fell 1.6% (+1.9% y/y) and reflected a 3.9% m/m decline in unit auto sales to 16.10M.
| May | April | Y/Y | 2005 | 2004 | 2003 | |
|---|---|---|---|---|---|---|
| Retail Sales & Food Services | 0.1% | 0.8% | 7.6% | 7.2% | 6.2% | 4.2% |
| Excluding Autos | 0.5% | 0.8% | 9.1% | 8.2% | 7.2% | 4.7% |
by Tom Moeller June 13, 2006
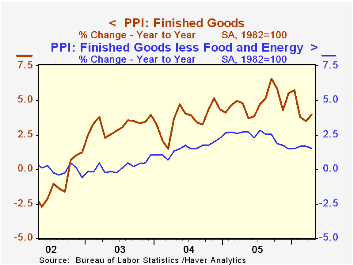
The finished goods producer price index rose 0.2% during May after the 0.9% spike in April. Consensus expectations had been for a 0.4% rise.
Prices less food & energy, however, were a bit firmer than expected during May. The 0.3% gain in the core PPI compared to Consensus expectations for a 0.2% rise and followed two months of 0.1% increase. During the last ten years there has been a 47% correlation between the y/y change in core producer prices and the change in the core CPI for goods. Over the last twenty years the correlation has been 78%.
Prices of all finished consumer goods less food & energy rose 0.2% (1.7% y/y). Durable consumer goods prices ticked up 0.1% (0.4% y/y) after an unchanged April reading. However, core consumer nondurable prices rose 0.4% (2.6% y/y). Capital equipment prices also were firm and rose 0.3% (1.4% y/y).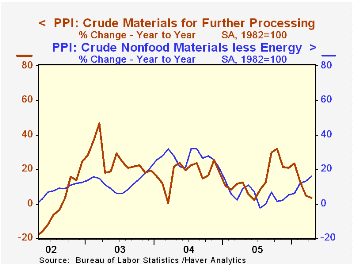
Finished energy prices rose 0.4% (20.1% y/y) after a 4.0% April spike. Gasoline prices rose 2.2% (42.4% y/y) and home heating oil rose 2.6% (39.4% y/y). Natural gas prices fell for the fourth month this year. The 3.1% decline nevertheless left prices up 9.4% versus one year ago.
Intermediate goods prices jumped another 1.1% as energy prices rose 1.1% (20.7% y/y). Core intermediate prices also jumped 1.1%.
Crude goods prices surged 2.0% as energy prices rose 2.5% (14.9% y/y). That gain, however, was eclipsed by a 6.2% jump in core crude prices. Copper base scrap (89.0% y/y), aluminum scrap (46.9% y/y) and iron & steel scrap (32.0% y/y) prices added to earlier strong gains. During the last thirty years "core" crude prices have been a fair indicator of industrial sector activity with a 48% correlation between the six month change in core crude prices and the change in factory sector industrial production.
| Producer Price Index | May | April | Y/Y | 2005 | 2004 | 2003 |
|---|---|---|---|---|---|---|
| Finished Goods | 0.2% | 0.9% | 4.3% | 4.9% | 3.6% | 3.2% |
| Core | 0.3% | 0.1% | 1.6% | 2.4% | 1.5% | 0.2% |
| Intermediate Goods | 1.1% | 0.9% | 8.8% | 8.0% | 6.6% | 4.7% |
| Core | 1.1% | 0.4% | 6.3% | 5.5% | 5.7% | 2.0% |
| Crude Goods | 2.0% | 1.2% | 8.7% | 14.6% | 17.5% | 25.1% |
| Core | 6.2% | 4.7% | 26.8% | 4.8% | 26.5% | 12.4% |
by Tom Moeller June 13, 2006
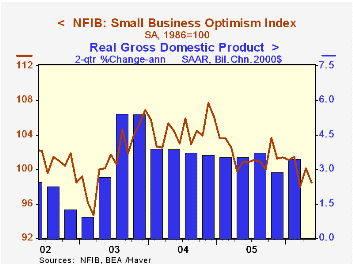
Small business optimism in May reversed most of the prior month's recovery with a 1.6% decline, according to the National Federation of Independent Business (NFIB).
During the last ten years there has been a 70% correlation between the level of the NFIB index and the two quarter change in real GDP.
Respondents expecting higher real sales in six months dipped but expectations that the economy would improve fell to the lowest level since early 2001.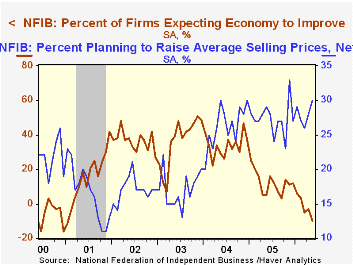
The percentage of firms with one or more job openings retraced all of an earlier improvement. During the last ten years there has been a 72% correlation between the NFIB percentage and the y/y change in nonfarm payrolls.
The percent planning to raise capital expenditures fell to the lowest percentage (28%) in two years..The percentage of firms planning to raise average selling prices rose to 30% though the percentage of firms actually raising prices slipped. During the last ten years there has been a 60% correlation between the change in the producer price index and the level of the NFIB price index.
About 24 million businesses exist in the United States. Small business creates 80% of all new jobs in America.
| Nat'l Federation of Independent Business | May | April | Y/Y | 2005 | 2004 | 2003 |
|---|---|---|---|---|---|---|
| Small Business Optimism Index (1986=100) | 98.5 | 100.1 | -2.3% | 101.6 | 104.6 | 101.3 |
by Tom Moeller June 13, 2006
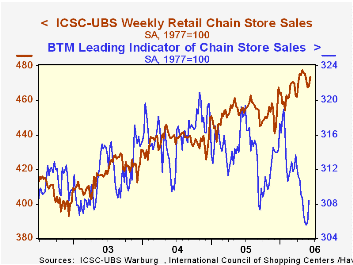
The International Council of Shopping Centers (ICSC)-UBS reported that chain store sales recovered last week from earlier weakness with a 1.2% surge.
The increase left sales in early June off a scant 0.4% from the May average which fell 0.4% from April. During the last ten years there has been a 47% correlation between the y/y change in chain store sales and the change in nonauto retail sales less gasoline.The ICSC-UBS retail chain-store sales index is constructed using the same-store sales (stores open for one year) reported by 78 stores of seven retailers: Dayton Hudson, Federated, Kmart, May, J.C. Penney, Sears and Wal-Mart.
The leading indicator of chain store sales from ICSC-UBS jumped 0.8% in early June (-2.9% y/y).
| ICSC-UBS (SA, 1977=100) | 06/10/06 | 06/03/06 | Y/Y | 2005 | 2004 | 2003 |
|---|---|---|---|---|---|---|
| Total Weekly Chain Store Sales | 473.6 | 468.1 | 4.0% | 3.6% | 4.7% | 2.9% |
by Tom Moeller June 13, 2006
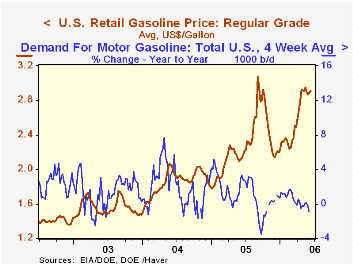
Retail gasoline prices rose again last week to $2.91 per gallon (36.4% y/y). The rise left gas prices in early June still off just slightly from an average $2.91 during May.
The spot market price for regular unleaded gasoline slipped yesterday to $2.07 per gallon, down from the high of $2.15 earlier in the month.
The price of West Texas Intermediate crude oil also slipped to $70.36 per barrel versus $70.94 averaged during May and a daily high of $74.62 in early May.
Demand for gasoline extended its usual seasonal rebound. During the last four weeks the demand for gasoline is up 5.1% versus a January low. The increase, however, still is somewhat less than the 6-9% recoveries during early 2004 and early 2005. The four week average of gasoline demand versus the year ago level was down 0.8%.
The latest Short-Term Energy and Summer Fuels Outlook from the U.S. Energy Information Administration can be found here.
| US Weekly | 06/12/06 | 06/05/06 | Y/Y | 2005 | 2004 | 2003 |
|---|---|---|---|---|---|---|
| U.S. Retail Gasoline, Regular per Gal. | $2.91 | $2.89 | 36.4% | $2.27 | $1.85 | $1.56 |
by Tom Moeller June 13, 2006
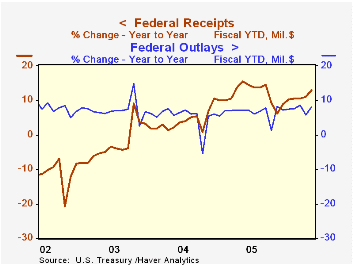
In May, the U.S. federal government ran a budget deficit of $42.8B that was slightly deeper than the deficit during the same month last year. The FY06 to-date budget deficit nevertheless narrowed to $227.0B versus a deficit of $272.3B during the first eight months of FY05.
Growth in net revenues FYTD versus the first eight months of FY05 improved to 12.9%. Individual income tax receipts (44% of total receipts) rose 13.6% FYTD as withheld taxes rose 7.5% and non-withheld taxes surged 21.6%. Corporate income taxes (10% of total receipts) similarly were strong and jumped 25.6% y/y during FY06's first eight months.
The improved job market lifted employment taxes (36% of total receipts) 7.5% y/y and estate & gift taxes surged another 15.7% y/y.
U.S. net outlays rose 8.0% FYTD versus '05. Defense spending (19% of total outlays) rose 7.0% during the first eight months of FY06 versus '05.Medicare spending (12% of total outlays) surged 12.2% while spending on social security (21% of total outlays) remained strong at 5.8%.
Presidential Approval Ratings: How Low Can Bush Go? from the American Enterprise Institute (AEI) can be found here.
| US Government Finance | May | April | Y/Y | FY 2005 | FY 2004 | FY 2003 |
|---|---|---|---|---|---|---|
| Budget Balance | $-42.8B | $118.9B | $-35.4B (5/05) | $-318.3B | $-412.7B | $-377.6B |
| Net Revenues | $192.7B | $315.1B | 26.1% | 14.5% | 5.5% | -3.8% |
| Net Outlays | $235.5B | $196.2B | 25.2% | 7.8% | 6.2% | 7.4% |
by Louise Curley June 13, 2006
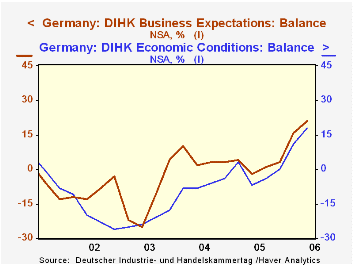
Two recent indicators of confidence in Germany show a mixed picture. Yesterday, the German Chamber of Commerce reported that a June survey of industrialists in some 25,000 companies showed that the balance of those expecting improvement in the outlook over those expecting worsening conditions rose to 21% from 16% in the February survey. There was an even greater increase from 11% to 18% in the industrialists appraisal of current conditions. The first chart shows the DIHK's (Deutscher Industrie und Handelskammertag) measures of confidence in the current situation and expectations for the future. (Since the surveys are conducted in only three months, February, June and October, we have interpolated the data in the chart.)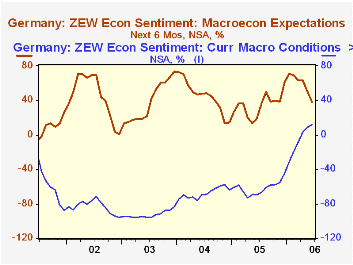
While industrialist remain positive about the prospects for the economy, the financial community in Germany is becoming increasingly concerned. The ZEW Center for European Economic Research announced today that its measure of confidence in the outlook, which polls some 350 institutional investors and analysts, dropped to 37.8% in June from 50.0% in May. The measure, which is the balance of optimists over pessimists, has been declining in each month since a recent peak of 71.0% was reached in January and it is the lowest value since July 2005. At the same time that fears over the outlook have risen, these investors continue to acknowledge that current conditions are improving. The second chart shows the balances of optimists over pessimists viewing the current situation and the outlook.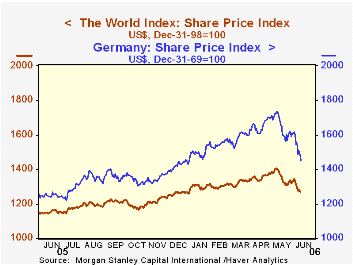
Perhaps the main reason for the loss of confidence among the financial community is the fear that further increases in interest rates may be necessary to counteract inflation. Already this fear has resulted in sharp declines in world stock markets. From May 8 to June 12, world stock prices as measured by MSCI (Morgan Stanley Capital International) fell by almost 10%. Stock prices in Germany fell by an even greater amount--14.5%. The third chart compares the MSCI indexes of world stock prices and those of Germany. (We have indexed both series to a common base--12/98=100).
| Germany | Jun 06 | May 06 | Apr 05 | Mar 06 | Feb 06 | Jan 06 | Oct 05 |
|---|---|---|---|---|---|---|---|
| DIHK Current Conditions | 18 | 11 | 0 | ||||
| DIHK Expectations | 21 | 16 | 3 | ||||
| ZEW Current Conditions | 11.9 | 8.7 | 2.9 | -8.4 | -19.5 | -31.6 | |
| ZEW Expectations | 37.8 | 50.0 | 62.7 | 63.4 | 69.8 | 71.0 | |
| Jun 12 | May 8 | Pct Chg | |||||
| MSCI World Stock Price (12/31/98=100) | 1269.595 | 1406.276 | 9.72 | ||||
| MSCI German Stock Price (12/31/69=100) | 1482.815 | 1734.694 | 14.52 |
Tom Moeller
AuthorMore in Author Profile »Prior to joining Haver Analytics in 2000, Mr. Moeller worked as the Economist at Chancellor Capital Management from 1985 to 1999. There, he developed comprehensive economic forecasts and interpreted economic data for equity and fixed income portfolio managers. Also at Chancellor, Mr. Moeller worked as an equity analyst and was responsible for researching and rating companies in the economically sensitive automobile and housing industries for investment in Chancellor’s equity portfolio. Prior to joining Chancellor, Mr. Moeller was an Economist at Citibank from 1979 to 1984. He also analyzed pricing behavior in the metals industry for the Council on Wage and Price Stability in Washington, D.C. In 1999, Mr. Moeller received the award for most accurate forecast from the Forecasters' Club of New York. From 1990 to 1992 he was President of the New York Association for Business Economists. Mr. Moeller earned an M.B.A. in Finance from Fordham University, where he graduated in 1987. He holds a Bachelor of Arts in Economics from George Washington University.
More Economy in Brief
 Global| Feb 05 2026
Charts of the Week: Balanced Policy, Resilient Data and AI Narratives
by:Andrew Cates


