 Global| Apr 13 2005
U.S. Retail Sales' Gain Light
by:Tom Moeller
|in:Economy in Brief
Summary
US retail sales rose 0.3% in March but the gain fell quite short of Consensus expectations for a 0.8% rise. The 0.5% increase in February was unrevised though figures back to 2003 were revised slightly lower. March sales excluding [...]
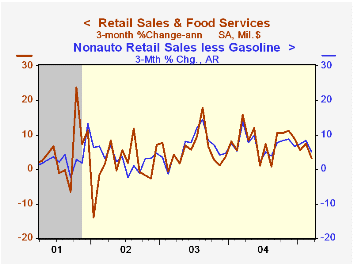
US retail sales rose 0.3% in March but the gain fell quite short of Consensus expectations for a 0.8% rise. The 0.5% increase in February was unrevised though figures back to 2003 were revised slightly lower.
March sales excluding motor vehicles also disappointed Consensus expectations for a 0.6% rise.The 0.1% up tick followed a downwardly revised 0.6% increase in February.
Spending on discretionary items eased after increasing strongly through February. Sales at furniture & home furnishings stores slipped 0.5% (+4.1% y/y) after a 1.5% February jump. General merchandise stores reversed an unrevised 0.7% (+4.4% y/y) gain in February and apparel store sales dropped 1.9% (+1.6% y/y) after unrevised gains of 1.1% and 1.9% during the prior two months.
March nonauto retail sales less gasoline fell 0.1% (+5.4% y/y) following a 0.5% February increase. Gasoline service station sales jumped 2.1% (17.8% y/y) as gasoline prices rose 8.9% to an average $2.08 per gallon. In the second week of April gasoline prices rose further to an average $2.28.
Sales of nonstore retailers (internet and catalogue) jumped 1.2% m/m (+13.4% y/y).
Building material store sales surged 1.5% (+5.5% y/y) but the y/y gain eased considerably from the earlier pace. The comparison was tough given the 9.7% m/m spike in March 2004.
Economic Policy and the Sustainability of U.S. Productivity Growth from New York Federal Reserve Bank President Timothy F. Geithner are available here.
The minutes to the latest meeting of the Federal Open Market Committee can be found here.
| Mar | Feb | Y/Y | 2004 | 2003 | 2002 | |
|---|---|---|---|---|---|---|
| Retail Sales & Food Services | 0.3% | 0.5% | 5.8% | 7.3% | 4.3% | 2.5% |
| Excluding Autos | 0.1% | 0.6% | 6.6% | 8.3% | 4.7% | 3.3% |
by Tom Moeller April 13, 2005
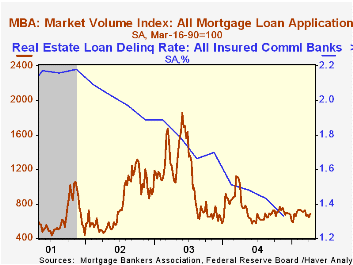
The Mortgage Bankers Association reported that mortgage applications recovered 6.1% last week to the highest level in four weeks. Nevertheless, the average level so far in April is 3.9% below March which fell 4.8% from February.
Purchase applications reversed all of the prior week's decline and rose 6.4%. The average so far in April is up 0.5% versus March. During the last ten years there has been a 50% correlation between the y/y change in purchase applications and the change in new plus existing single family home sales.
Applications to refinance recovered all of the prior two weeks' declines with a 5.6% jump though the April average still is down 9.8% from March.
The effective interest rate on a conventional 30-year mortgage rose to 6.22% and the effective rate on a 15-year mortgage rose to 5.85%.
The Mortgage Bankers Association surveys between 20 to 35 of the top lenders in the U.S. housing industry to derive its refinance, purchase and market indexes. The weekly survey accounts for more than 40% of all applications processed each week by mortgage lenders. Visit the Mortgage Bankers Association site here.
Moving Up: Trends in Homeownership and Mortgage Indebtedness from the Federal Reserve Bank of Philadelphia can be found here.
| MBA Mortgage Applications (3/16/90=100) | 04/08/05 | 04/01/05 | Y/Y | 2004 | 2003 | 2002 |
|---|---|---|---|---|---|---|
| Total Market Index | 683.6 | 644.5 | -13.3% | 735.1 | 1,067.9 | 799.7 |
| Purchase | 474.5 | 446.0 | 9.8% | 454.5 | 395.1 | 354.7 |
| Refinancing | 1,899.6 | 1,798.8 | -33.6% | 2,366.8 | 4,981.8 | 3,388.0 |
by Carol Stone April 13, 2005
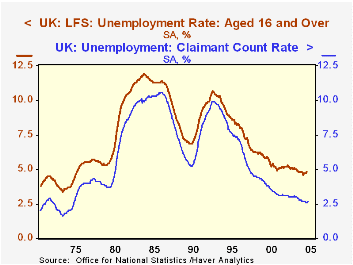
Press reports on today's UK labor force data highlight the increase in unemployment measures. The ILO-defined concept, similar to that in the US, rose in the three months to February by 0.1% to 4.8%. The so-called "claimant count" increased 11,000 in March, with the associated rate rising to 2.7% from 2.6% in February. Wire service headlines and story leads pointed out that this was the largest monthly increase in claimants since May 2003, and noted that it was unfortunate coincidence that the news came on the very day the Prime Minister and the Labour Party begin their quest for reelection next month.
There are offsetting factors, though, that remove some of the sting from these unemployment figures. Firstly, both unemployment rates even at their new, slightly increased levels, remain the second lowest in nearly 30 years. Except for three recent months at 2.6%, the claimant count rate has not been as low as 2.7% since May 1975. The broader ILO unemployment rate was at or above 4.8% from September 1975 through last June; since then, the low was just 4.6% in August. So these latest figures hardly indicate a significant upturn, let alone a major uptrend in unemployment. (The ILO definition represents a three-month moving average centered on January.)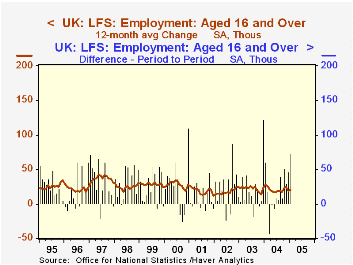
Moreover, employment rose once again and by a larger amount than in the previous several reports. The labor force measure, the number of people saying they have jobs, rose 72,000 to 28.64 million, still another a new high. This too is a 3-month centered moving average for January, compared to the December figure.
The average earnings index (AEI) for February (a 3-month moving average ending in February) was up 4.7% on a year ago, compared with 4.4% in the previous couple of reports. However, the acceleration was due to bonus payments, as the underlying base earnings measure eased to 4.3% from 4.4%.
| United Kingdom Seasonally adjusted data |
Mar 2005 | Feb 2005 | Jan 2005 | Dec 2004 | 2004 | 2003 | 2002 |
|---|---|---|---|---|---|---|---|
| Unemployment Rate (%) | 4.8* | 4.7* | 4.7 | 5.0 | 5.2 | ||
| Claimant Count (thous) | 829 | 818 | 814 | 824 | 854 | 933 | 947 |
| Employment (mil) | 28.64* | 28.57* | 28.44 | 28.18 | 27.91 | ||
| Change (thous) | +72K | +46K | +0.9% | +0.9% | +0.8% | ||
| Average Earnings Index Incl Bonuses: "Headline Rate"(%)** | 4.7 | 4.4 | 4.4 | 4.4 | 3.4 | 3.5 | |
| Average Earnings Index Ex Bonuses: "Headline Rate" (%)** | 4.3 | 4.4 | 4.4 | 4.2 | 3.6 | 4.0 |

Tom Moeller
AuthorMore in Author Profile »Prior to joining Haver Analytics in 2000, Mr. Moeller worked as the Economist at Chancellor Capital Management from 1985 to 1999. There, he developed comprehensive economic forecasts and interpreted economic data for equity and fixed income portfolio managers. Also at Chancellor, Mr. Moeller worked as an equity analyst and was responsible for researching and rating companies in the economically sensitive automobile and housing industries for investment in Chancellor’s equity portfolio. Prior to joining Chancellor, Mr. Moeller was an Economist at Citibank from 1979 to 1984. He also analyzed pricing behavior in the metals industry for the Council on Wage and Price Stability in Washington, D.C. In 1999, Mr. Moeller received the award for most accurate forecast from the Forecasters' Club of New York. From 1990 to 1992 he was President of the New York Association for Business Economists. Mr. Moeller earned an M.B.A. in Finance from Fordham University, where he graduated in 1987. He holds a Bachelor of Arts in Economics from George Washington University.
More Economy in Brief


