 Global| Jun 12 2008
U.S. Retail Sales Firmed
by:Tom Moeller
|in:Economy in Brief
Summary
U.S. retail sales last month were stronger-than-expected, boosted by early receipts of the government's tax rebate checks - $600 per person and $300 per child for families. A 1.0% May jump in sales followed an upwardly revised 0.4% [...]
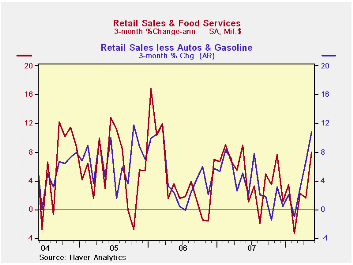
U.S. retail sales last month were stronger-than-expected, boosted by early receipts of the government's tax rebate checks - $600 per person and $300 per child for families. A 1.0% May jump in sales followed an upwardly revised 0.4% April increase, initially reported as a 0.2% decline. On a three-month basis overall retail sales were down 2.0% (AR).
Sales of motor vehicles & parts ticked up 0.3% (-7.0%
y/y) following three months of decline. The increase accompanied a 1.1%
decline in unit motor vehicle sales.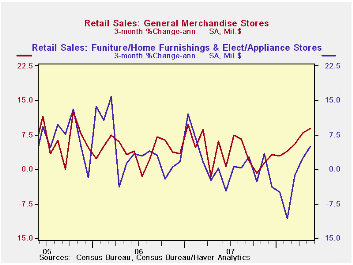
Retail sales excluding autos rose 1.2% and the April rise of 1.0% was double last month's estimate. The gain also exceeded Consensus expectations for a 0.6% increase.
Higher prices for gasoline boosted sales at service stations by 2.6% (13.8% y/y). Nevertheless, less gasoline & autos, retail sales still surged 1.0% (3.7% y/y) and the April increase was about doubled to 1.1% (3.7% y/y). On a three-month basis these sales jumped at a 10.7% annual rate.
May sales of nonstore retailers (internet &
catalogue) surged 1.6% (10.0% y/y) after very much upwardly
revised gains during the prior two months of 3.2% and 1.7%.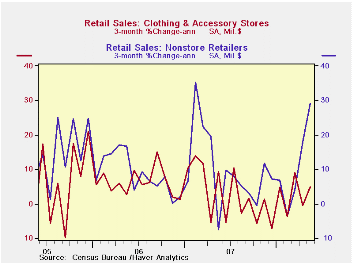
Sales of discretionary items improved. Sales at general merchandise stores surged 1.2% (5.1% y/y) following gains between 0.4% and 1.0% during the prior three months.Furniture, home furnishings & appliance store sales rose 0.6% (-0.7% y/y) for the second month. The gain, however, followed four months when sales were unchanged or down. The rise reflected higher sales of electronics & appliances which rose 0.7% (3.7% y/y) after a 1.1% April jump. Sales of furniture & home furnishings increased just 0.4% (-4.9% y/y) after a year of monthly declines. Apparel store sales rose 0.5% (-0.1% y/y) but the April increase was lessened to 0.1%.
Building materials & garden equipment sales surged again by 2.4% (-3.2% y/y) following a like increase during April.
Restaurant and drinking places sales also jumped, by 0.8% (5.1% y/y) last month after an upwardly revised 1.2% increase.
The latest Beige Book covering regional economic conditions from the Federal Reserve Board can be found here.
| May | April | Y/Y | 2007 | 2006 | 2005 | |
|---|---|---|---|---|---|---|
| Retail Sales & Food Services | 1.0% | 0.4% | 2.5% | 4.0% | 5.8% | 6.4% |
| Excluding Autos | 1.2% | 1.0% | 4.9% | 4.5% | 6.8% | 7.5% |
| Less Gasoline | 1.0% | 1.1% | 3.7% | 4.1% | 6.2% | 6.4% |
by Tom Moeller June 12, 2008
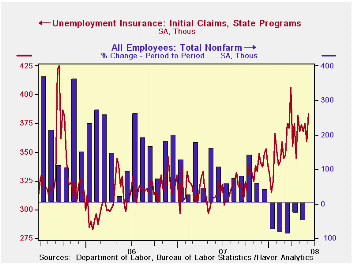
Initial claims for unemployment insurance rose 25,000 last week to 384,000 from an upwardly revised level of 359,000 during the prior week. Consensus expectations had been for a lesser increase to 365,000 claims.
The four week moving average of initial claims rose slightly week-to-week to 371,500 (19.4% y/y) and the recent average was up slightly from April when claims averaged 364,000. These numbers are down from March when initial claims averaged 375,000.
A claims level below 400,000 typically has been associated with growth in nonfarm payrolls. During the last ten years there has been a (negative) 76% correlation between the level of initial claims and the m/m change in nonfarm payroll employment.
Continuing claims for unemployment insurance rose 58,000 and made up all of a revised 28,000 decline during the prior week. The latest level was the highest since February 2004. The four week average of continuing claims rose to 3,099, 250 and the number provides some indication of workers' ability to find employment.
The continuing claims numbers lag the initial claims figures by one week.
The insured rate of unemployment rose to 2.4% after six weeks at 2.3%. The latest was the highest since mid-2004.
Lessons for Central Bankers from a Phillips Curve Framework is yesterday's speech by Fed Vice Chairman Donald L. Kohn and it is available here.
| Unemployment Insurance (000s) | 06/07/08 | 05/31/08 | Y/Y | 2007 | 2006 | 2005 |
|---|---|---|---|---|---|---|
| Initial Claims | 384 | 359 | 22.3% | 322 | 313 | 331 |
| Continuing Claims | -- | 3,139 | 25.6% | 2,552 | 2,459 | 2,662 |
by Tom Moeller June 12, 2008
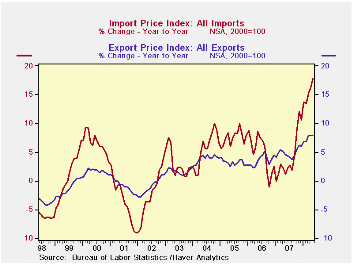
U.S. import prices, overall, surged another 2.3% last month and the gain was right in-line with expectations. It followed a like 2.4% April increase which was upwardly revised from 1.8%. During the last three months import prices have risen at a 35.4% annual rate which was the quickest since late 1990.
Petroleum prices jumped further by 7.8% and imported crude petroleum prices already are up another 10% this month versus May.
Less petroleum, the gain in import prices eased to 0.5% from an upwardly revised 1.3% during April. Pushed higher by the lower foreign exchange value of the dollar, the price increases during the last three months are the fastest on record.
During
the last ten years there has been a 66% (negative) correlation between
the nominal trade-weighted exchange value of the US dollar vs. major
currencies and the y/y change in non oil import prices. The correlation
is a reduced 47% against a broader basket of currencies.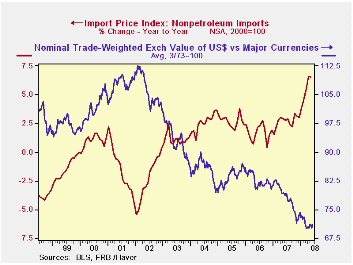
Prices for industrial supplies & materials excluding oil surged another 1.8% (17.0% y/y) in May. These prices are up at a 36.5% rate so far this year due to strength in finished metal, chemicals and agricultural prices. The detailed import price series can be found in the Haver USINT database.
Capital goods import prices increased 0.3% after an upwardly revised 0.9% April rise. So far this year prices have risen at a 2.9% rate after a 0.4% increase last year, but less the lower prices of computers, capital goods prices have risen at a 7.1% in 2008 through May. That's after a 2.7% rise during all of 2007. Prices of computers, peripherals and accessories have fallen at a 6.4% rate this year after the 5.1% 2007 decline.
Finally, prices for nonauto consumer goods imports have risen at a 5.5% in 2008 after the 1.6% increase last year. This year's gain in prices is the quickest since 1992 and has been notable for durables (5.9%), apparel (2.4%) and other nondurable products (9.6%).
Total export prices increased 0.3% as agricultural prices rose 0.3% (33.3% y/y) after a 2.1% April drop. Nonagricultural export prices rose 0.4% (5.7% y/y).
| Import/Export Prices (NSA) | May | April | Y/Y | 2007 | 2006 | 2005 |
|---|---|---|---|---|---|---|
| Import - All Commodities | 2.3% | 2.4% | 17.8% | 4.2% | 4.9% | 7.5% |
| Petroleum | 7.8% | 5.9% | 68.8% | 11.6% | 20.6% | 37.6% |
| Non-petroleum | 0.5% | 1.3% | 6.6% | 2.7% | 1.7% | 2.7% |
| Export- All Commodities | 0.3% | 0.5% | 8.0% | 4.9% | 3.6% | 3.2% |
by Tom Moeller June 12, 2008
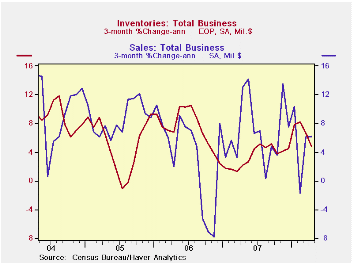
Total business inventories increased 0.5% after a little-revised 0.2% gain during March. The April rise was greater than expectations for a 0.3% increase. Annualized, three-month growth in inventories backed off further to 4.7% from the elevated 8.2% growth rate in February.
Retail inventories rose 0.4% following two month of decline. The three-month growth rate remained negative at -1.2%. Inventories of motor vehicle & parts fell at a 4.2% annual rate during the last three months due to further production cutbacks. Outside of autos, retail inventories rose 0.2% after a 1.1% drop during March and they are essentially unchanged during the last three months.
The industry detail in the retail sector indicated that
furniture inventories fell at an annual rate of 1.2% during the last
three months. Clothing & accessory store inventories fell hard
at a 4.9% rate while general merchandise stores' inventories dropped at
a 2.6% rate.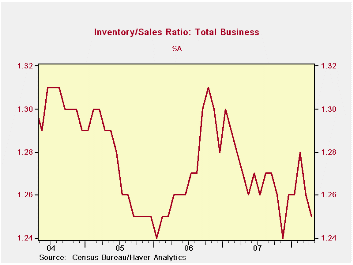
Factory inventories fell just slightly in April and three-month growth fell to 6.2% (AR) which was half the growth earlier this year. Despite the rise in oil prices, petroleum inventories fell at a 2.6% rate over the last three months after spiking earlier this year. Elsewhere, factory inventory accumulation has been fairly steady in 2008 at a 6.9% rate.
Wholesale inventories have risen at a 10.2% rate during the last three months, juiced by the rise in oil prices. Less petroleum, inventories still have been firm, however, rising at a 9.8% rate which was twice the rate of increase during all of last year.
Total business sales surged again, by 1.4% led by a 2.2% surge in factory shipments. Three-month growth held steady at a 6.2% annual rate.
The inventory-to-sales ratio for all business fell to 1.25 in April from 1.27 during 1Q and from 1.27 during the prior three years.
Protecting Consumers in the Credit Marketplace is yesterday's speech by Fed Governor Randall S. Kroszner and it can be found here.
| Business Inventories | April | March | Y/Y | 2007 | 2006 | 2005 |
|---|---|---|---|---|---|---|
| Total | 0.5% | 0.2% | 5.4% | 3.8% | 5.9% | 6.0% |
| Retail | 0.4% | -0.6% | 2.5% | 2.6% | 3.5% | 2.3% |
| Retail excl. Auto | 0.7% | -0.4% | 2.3% | 2.7% | 4.9% | 3.9% |
| Wholesale | 1.3% | 0.1% | 8.1% | 5.5% | 8.3% | 7.3% |
| Manufacturing | -0.0% | 0.9% | 6.0% | 3.7% | 6.4% | 8.9% |
by Robert Brusca June 12, 2008

In April EMU-wide industrial output rose by 0.3% but that was after a drop of 0.6% in March. While the Yr/Yr growth rate seems a lot higher at 2.9% in April compared to 1.4% in March, growth is actually fading. The monthly gain in April does not make up for the weakness in March. As a result the quarter to date growth in EMU-wide IP is running at a negative rate of 0.3%, a slight annual rate decline in 2008-Q2.
Consumer goods output is dropping at -0.5% annual rate clearly the weak sector in 2008-Q2, despite a sharp gain of 1.7% in April. Intermediate goods output is nearly flat and has been choppy in recent months. Capital goods output remains as it has been, the driver of industrial growth, rebounding sharply by 2% in April after a 1.6% drop in March and growing at a 6.5% annual rate in 2008-Q2.
The chart on the left shows that this month’s rebound in output comes in the face of a clear declining trend for output of consumer and intermediate goods. For capital goods the trend is not clear except that this month’s sharp gain arrests, for at least one month, what had seemed to be the onset of a declining trend there. Instead, all we can say is that capital goods output has become very volatile. This has come at a time that weather effects and the calendar placement of Easter have been beneficial to the euro-economy. So if these sorts of ephemeral factors are responsible for the monthly rebound we could see the onset of true trend and weaker growth in the months ahead.
| Euro Area MFG IP | ||||||||||
|---|---|---|---|---|---|---|---|---|---|---|
| SAAR except m/m | Mo/Mo | Apr 08 |
Mar 08 |
Apr 08 |
Mar 08 |
Apr 08 |
Mar 08 |
|||
| Euro Area Detail | Apr 08 |
Mar 08 |
Feb 08 |
3Mo | 3Mo | 6mo | 6mo | 12mo | 12mo | Q-2- Date |
| MFG | 0.3% | -0.6% | 0.1% | -0.7% | 3.0% | 1.6% | 2.2% | 2.9% | 1.4% | -0.3% |
| Consumer | 0.4% | -0.6% | -0.4% | -2.1% | -0.4% | -0.3% | -0.8% | 0.6% | -1.1% | -0.5% |
| C-Durables | 1.7% | -1.6% | -0.1% | -0.1% | 1.2% | -0.3% | -3.4% | 1.1% | -3.2% | |
| C-Nondurables | 0.2% | -0.5% | -0.4% | -2.4% | -0.6% | -0.1% | -0.4% | 0.6% | -0.6% | |
| Intermediate | 0.3% | -0.5% | 0.3% | 0.1% | 2.1% | 1.2% | 1.9% | 2.5% | 0.6% | 0.1% |
| Capital | 2.0% | -1.6% | 0.5% | 3.4% | 5.9% | 6.0% | 4.0% | 7.5% | 3.6% | 6.5% |

Tom Moeller
AuthorMore in Author Profile »Prior to joining Haver Analytics in 2000, Mr. Moeller worked as the Economist at Chancellor Capital Management from 1985 to 1999. There, he developed comprehensive economic forecasts and interpreted economic data for equity and fixed income portfolio managers. Also at Chancellor, Mr. Moeller worked as an equity analyst and was responsible for researching and rating companies in the economically sensitive automobile and housing industries for investment in Chancellor’s equity portfolio. Prior to joining Chancellor, Mr. Moeller was an Economist at Citibank from 1979 to 1984. He also analyzed pricing behavior in the metals industry for the Council on Wage and Price Stability in Washington, D.C. In 1999, Mr. Moeller received the award for most accurate forecast from the Forecasters' Club of New York. From 1990 to 1992 he was President of the New York Association for Business Economists. Mr. Moeller earned an M.B.A. in Finance from Fordham University, where he graduated in 1987. He holds a Bachelor of Arts in Economics from George Washington University.
More Economy in Brief


