 Global| Mar 15 2005
U.S. Retail Sales Firm
by:Tom Moeller
|in:Economy in Brief
Summary
US retail sales rose 0.5% last month and about matched Consensus expectations. The gain was accompanied, however, by an upward revision to January sales which are now estimated to have risen 0.3% versus the initial report of a 0.3% [...]
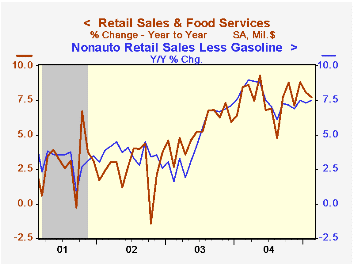
US retail sales rose 0.5% last month and about matched Consensus expectations. The gain was accompanied, however, by an upward revision to January sales which are now estimated to have risen 0.3% versus the initial report of a 0.3% decline.
Sales excluding motor vehicles rose 0.4% in February following a revised 1.0% January increase which was nearly double the initial report. Consensus expectations had been for a 0.8% rise in February nonauto sales.
The tone of spending on discretionary items appears firmer than it did last month due to strong February increases and upward revisions to January results. Sales at furniture & home furnishings stores jumped 1.1% (5.9% y/y) after a 1.4% January spurt. Apparel store sales added 1.1% (5.0% y/y) to a 1.7% January leap and February sales at general merchandise stores rose 0.7% (6.6% y/y).
Sales of nonstore retailers (internet and catalogue) slipped marginally m/m (+12.5% y/y) but January now is estimated at up 1.0%.
Gasoline service station sales rose 0.9% (16.4% y/y) on the strength of a 4.3% increase in gasoline prices to an average $1.91 per gallon. In the latest week gasoline prices averaged a near record $2.06. Nonauto retail sales less gasoline rose 0.4% (7.5% y/y) in February after a 1.0% January increase
Building material store sales fell 1.3% (+13.1% y/y).
| Feb | Jan | Y/Y | 2004 | 2003 | 2002 | |
|---|---|---|---|---|---|---|
| Retail Sales & Food Services | 0.5% | 0.3% | 7.7% | 7.6% | 5.3% | 2.5% |
| Excluding Autos | 0.4% | 1.0% | 8.4% | 8.5% | 5.2% | 3.2% |
by Tom Moeller March 15, 2005
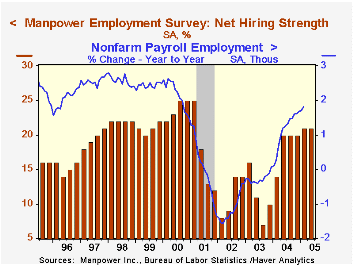
The Manpower Employment Outlook Survey indicated further growth in U.S. jobs. The 2Q05 index of hiring intentions held at 21 and was nearly double the index's level two years ago. The index indicates that a net 21% of 16,000 employers expect to increase hiring activity.
Since 1980 there has been a 74% correlation between the Manpower index and the y/y change in non-farm payrolls.
Not seasonally adjusted, 30% of employers planned to raise employment in 2Q04, the highest since late 2000, while only 7% planned to decrease employment.
Improvement in hiring intentions versus last year was widespread across industries but notable in finance/insurance/real estate, education and public administration. Moderate improvement continued in manufacturing industries but the gains contrast with net job loss three years ago.
The latest press release from Manpower Inc. covering global employment prospects can be viewed here.
| Manpower Employment Survey | 2Q '05 | 1Q '05 | 2Q '04 | 2004 | 2003 | 2002 |
|---|---|---|---|---|---|---|
| All Industries - Net Higher (SA) | 21 | 21 | 20 | 19 | 11 | 11 |
by Tom Moeller March 15, 2005
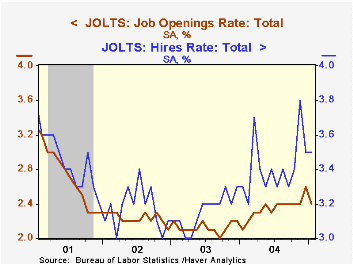
The Job Openings & Labor Turnover Survey (JOLTS) from the Bureau of Labor Statistics indicated the job openings rate eased in January to 2.4% versus 2.6% in December. The job openings rate is the number of job openings on the last business day of the month as a percent of total employment plus job openings.
The hires rate held in January at December's upwardly revised 3.5%. The hires rate is the number of hires during the month divided by employment.
The total number of job openings fell 5.8% (+15.4% y/y) after a 7.0% gain in December.
Job separations fell 1.7% m/m (+9.2% y/y). The separation rate held steady at 3.3%. Total separations include quits, layoffs, discharges, and other separations as well as retirements. The total separations, or turnover, rate is the total number of separations during the month divided by employment.
The survey dates only to December 2000 but has since followed the movement in nonfarm payrolls.
From the U.S. Department of Labor, a description of the Jolts survey and the latest release is available here.
| JOLTS (Job Openings & Labor Turnover Survey) | Jan | Dec | Jan '04 | 2004 | 2003 | 2002 |
|---|---|---|---|---|---|---|
| Job Openings Rate: Total | 2.4% | 2.6% | 2.1% | 2.4% | 2.1% | 2.2% |
| Hires Rate: Total | 3.5% | 3.5% | 3.3% | 3.4% | 3.2% | 3.2% |
by Tom Moeller March 15, 2005
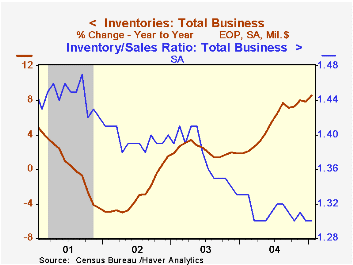
Total business inventories jumped 0.9% in January following an unrevised 0.2% December rise. The pace of inventory accumulation has accelerated markedly since 2002 but has not kept pace with the improvement in sales growth. Consequently the ratio of inventories-to-sales fell through last year and in January remained at the record low.
Inventory accumulation was strongest in January at the factory level where a 1.3% gain was the largest monthly increase since 1988.
Wholesale inventories jumped 1.1%. During the last ten years there has been a 64% correlation between the y/y change in wholesale inventories and the change in imports of merchandise.
Retail inventories rose 0.4% in January following a 0.3% December increase. Accumulation of non-auto retail inventories, however, again was quite strong up 0.8% led by a 19.8% y/y gain in building materials and a 7.8% y/y rise in furniture & electronics.
Overall business sales jumped 0.8% (+11.1% y/y).
| Business Inventories | Jan | Dec | Y/Y | 2004 | 2003 | 2002 |
|---|---|---|---|---|---|---|
| Total | 0.9% | 0.2% | 8.6% | 7.9% | 1.9% | 1.5% |
| Retail | 0.4% | 0.3% | 6.4% | 6.0% | 5.0% | 6.0% |
| Retail excl. Autos | 0.8% | 1.1% | 7.5% | 6.5% | 2.9% | 2.6% |
| Wholesale | 1.1% | 0.4% | 12.3% | 11.2% | 2.2% | 0.4% |
| Manufacturing | 1.3% | 0.1% | 8.5% | 7.5% | -1.3% | -1.8% |
by Tom Moeller March 15, 2005
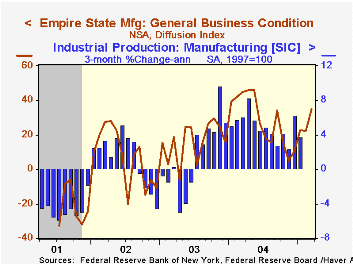
The Empire State Index of General Business Conditions in New York's manufacturing industries inched higher in March to 19.61 but remained well below its level a year ago.
The new orders component improved sharply to the highest level since last September and the employment measure rose as well to its highest since September. Like the Philadelphia Fed Index of General Business Conditions, the Empire State Business Conditions Index reflects answers to an independent survey question; it is not a weighted combination of the components.
The prices paid index rose and reversed all of the moderate decline in February.
Expectations for business conditions in six months rose to the highest level this year. 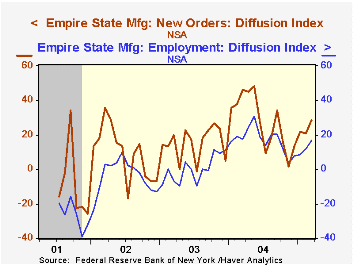
The Empire State Manufacturing Survey is a monthly survey of manufacturers in New York State conducted by the Federal Reserve Bank of New York. Participants from across the state in a variety of industries respond to a questionnaire and report the change in a variety of indicators from the previous month. Respondents also state the likely direction of these same indicators six months ahead. April 2002 is the first report, although survey data date back to July 2001.
For more on the Empire State Manufacturing Survey, including methodologies and the latest report, click here.
| Empire State Manufacturing Survey | Mar | Feb | Mar '04 | 2004 | 2003 | 2002 |
|---|---|---|---|---|---|---|
| General Business Conditions (diffusion index) | 19.61 | 19.19 | 28.15 | 28.76 | 16.17 | 7.19 |
by Tom Moeller March 15, 2005
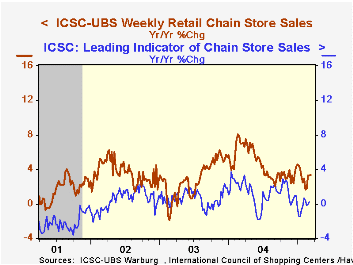
Chain store sales last week recovered all of the prior week's decline with a 0.6% increase according to the International Council of Shopping Centers (ICSC)-UBS survey.
Sales so far in March are 1.1% ahead of the February average which rose 1.0% from January.
During the last ten years there has been a 59% correlation between y/y change in chain store sales and the change in non-auto retail sales less gasoline, as published by the US Census Department.
The leading indicator of chain store sales from ICSC inched up 0.3% in the latest week (0.2% y/y). The indicator's February average rose 0.4% following a 0.6% January decline.
The ICSC-UBS retail chain-store sales index is constructed using the same-store sales (stores open for one year) reported by 78 stores of seven retailers: Dayton Hudson, Federated, Kmart, May, J.C. Penney, Sears and Wal-Mart.
| ICSC-UBS (SA, 1977=100) | 03/12/05 | 03/05/05 | Y/Y | 2004 | 2003 | 2002 |
|---|---|---|---|---|---|---|
| Total Weekly Chain Store Sales | 453.6 | 450.8 | 3.4% | 4.6% | 2.9% | 3.6% |
by Louise Curley March 15, 2005
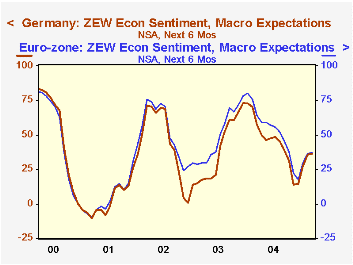
The ZEW Center for European Economic Research in Mannheim, Germany, reported that German analysts and institutional investors became slightly more optimistic regarding Germany's economic prospects over the next six months. The proportion of optimists over pessimists rose to 36.3% in March from 35.9% in February. Although this figure is well below the 73.4% reached in December 2003, it is 22.4 percentage points above the recent low of 13.9% recorded in November of last year.
Haver has recently added ZEW data regarding appraisals of current condition and expectations of conditions six months ahead for the Euro zone. For the six month outlook for the Euro Zone as a whole, the proportion of optimists over pessimists rose to 37.3% in March from 36.0% in February. This figures is 42.8 percentage points below the recent peak of 80.1 in January, 2004 and 19.6 points above the low of 17.7 in December 2004. The attached chart compares the expectations for Germany with those for the Euro Zone as a whole. As Germany is such a large component of the Euro Zone, the two series tend to move together.
In addition to appraisals of current conditions and expectations of conditions six months ahead for the entire Euro Zone, Haver has added appraisals of the profit outlook six months ahead for thirteen industries: banking, insurance, vehicles/automotive, chemical/pharmaceutical, steel/metal, electronics, machinery, consumption/ trade, construction, utilities, services, telecommunications and information technology. The March data show that, except for the consumption/trade and construction industries, optimists exceeded pessimists in appraising the profit outlook of all the other industries. The excess of optimists over pessimists varied from 28.8% for the electronics industry to 59.% for information technology.
| Germany: ZEW index | Mar 05 | Feb 05 | Mar 04 | M/M dif | Y/Y dif | 2004 | 2003 | 2002 |
|---|---|---|---|---|---|---|---|---|
| Macroeconomic conditions 6 months ahead |
||||||||
| Germany | 36.3 | 35.9 | 57.6 | 0.4 | -21.3 | 44.6 | 38.4 | 45.3 |
| Euro Zone | 37.3 | 36.0 | 64.3 | 1.3 | -27.0 | 52.1 | 48.9 | 53.1 |
| Profit expectations | ||||||||
| Banking | 55.5 | 54.9 | 71.2 | 0.6 | -15.7 | 59.6 | 30.5 | -8.4 |
| Insurance | 43.1 | 41.2 | 62.2 | 1.9 | -19.1 | 56.5 | 27.8 | 6.6 |
| Vehicle/automotive | -2.9 | 3.2 | -6.7 | -6.1 | 3.8 | -0.1 | -8.2 | -6.0 |
| Chem./pharmaceutical | 50.5 | 47.5 | 37.8 | 3.0 | 12.7 | 37.5 | 25.8 | 25.4 |
| Steel/metal | 45.0 | 47.1 | 41.6 | -2.1 | 3.4 | 48.7 | 13.1 | 4.7 |
| Electronics | 28.8 | 27.2 | 49.9 | 1.6 | -21.1 | 46.6 | 19.9 | 11.9 |
| Machinery | 45.6 | 46.0 | 46.6 | -0.4 | -1.0 | 53.4 | 7.0 | 5.4 |
| Consumption/trade | -0.4 | 9.0 | 7.9 | -9.4 | -8.3 | -0.8 | 2.2 | -8.6 |
| Construction | -22.6 | -24.6 | -4.7 | 2.0 | -17.9 | -18.2 | -33.7 | -28.9 |
| Utilities | 42.6 | 49.7 | 45.9 | -7.1 | -3.3 | 46.9 | 19.1 | 18.2 |
| Services | 52.2 | 55.2 | 62.4 | -3.0 | -10.2 | 58.0 | 35.2 | 25.4 |
| Telecommunications | 56.5 | 58.0 | 71.7 | -1.5 | -15.2 | 62.5 | 49.7 | 9.8 |
| Information technology | 59.4 | 52.4 | 68.4 | 7.0 | -9.0 | 63.0 | 45.2 | 17.6 |

Tom Moeller
AuthorMore in Author Profile »Prior to joining Haver Analytics in 2000, Mr. Moeller worked as the Economist at Chancellor Capital Management from 1985 to 1999. There, he developed comprehensive economic forecasts and interpreted economic data for equity and fixed income portfolio managers. Also at Chancellor, Mr. Moeller worked as an equity analyst and was responsible for researching and rating companies in the economically sensitive automobile and housing industries for investment in Chancellor’s equity portfolio. Prior to joining Chancellor, Mr. Moeller was an Economist at Citibank from 1979 to 1984. He also analyzed pricing behavior in the metals industry for the Council on Wage and Price Stability in Washington, D.C. In 1999, Mr. Moeller received the award for most accurate forecast from the Forecasters' Club of New York. From 1990 to 1992 he was President of the New York Association for Business Economists. Mr. Moeller earned an M.B.A. in Finance from Fordham University, where he graduated in 1987. He holds a Bachelor of Arts in Economics from George Washington University.
More Economy in Brief


