 Global| Aug 13 2008
U.S. Retail Sales Dipped As Expected, Internet & Catalogue Sales Jumped
by:Tom Moeller
|in:Economy in Brief
Summary
U.S. retail sales last month dipped 0.1%, right on Consensus expectations. The decline followed an upwardly revised June rise of 0.3%. On a three-month basis overall retail sales rose at a 4.1% annual rate, even with last year's 4.0% [...]
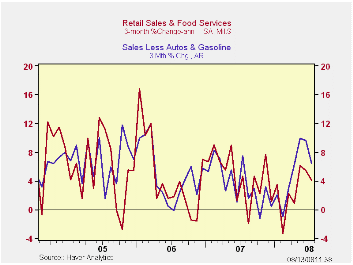
U.S. retail sales last month dipped 0.1%, right on Consensus expectations. The decline followed an upwardly revised June rise of 0.3%. On a three-month basis overall retail sales rose at a 4.1% annual rate, even with last year's 4.0% increase.
The overall gain was diminished by another sharp decline in sales of motor vehicles & parts. A 2.4% drop (-10.5% y/y) followed the 2.1% June decline (revised shallower) and they are down at a 19.7% annual rate during the last three months.
Retail sales excluding autos rose 0.4% in
July. That increase about equaled Consensus expectations.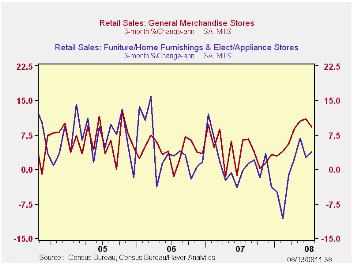
Higher gas prices again lifted retail sales last month. Sales at gasoline service stations increased 0.8% (24.6% y/y) after gains of 4.0% and 3.3% during the prior two months.
Less gasoline & autos, retail sales rose 0.3% (3.4% y/y) following an upwardly revised 0.4% increase during June. Still, the latest increase was the weakest since February. Sales on a three-month basis rose at a firm 6.4% annual rate.
Purchases made from home continued strong as July sales of nonstore retailers (internet & catalogue) jumped 1.1% (7.7% y/y). That followed an unrevised 0.8% June increase. On a three-month basis these sales rose at a 12.4% annual rate.
Sales at general merchandise stores rose 0.3% (5.2% y/y) following an upwardly revised 0.6% gain during June. Sales offurniture, home furnishings & appliance reversed the June decline and rose 0.9% (-0.2% y/y). Sales of furniture & home furnishings rose 1.0% (-4.8% y/y). Apparel store sales ticked up 0.2% (0.9% y/y).
Building materials & garden equipment sales reversed their June decline and rose 0.3% (-1.0% y/y).
Unanchored Expectations? Interpreting the Evidence from Inflation Surveys from the Federal Reserve Bank of San Francisco is available here.
| July | June | Y/Y | 2007 | 2006 | 2005 | |
|---|---|---|---|---|---|---|
| Retail Sales & Food Services | -0.1% | 0.3% | 2.6% | 4.0% | 5.8% | 6.4% |
| Excluding Autos | 0.4% | 0.9% | 6.0% | 4.5% | 6.8% | 7.5% |
| Less Gasoline | 0.3% | 0.4% | 3.4% | 4.1% | 6.2% | 6.4% |
by Tom Moeller August 13, 2008
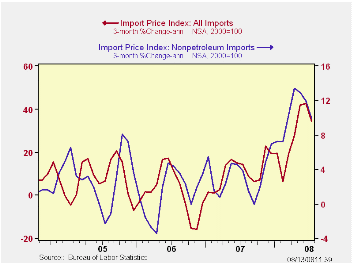
U.S. import prices overall jumped 1.7% last month after gains between 2.0% and 3.0% during the prior four months. The latest rise nearly doubled expectations for a 1.0% increase. During the last three months import prices have risen at a 34.3% annual rate which again was near the quickest since late-1990.
The rise continued to be led by the strength in petroleum prices which jumped 4.0% and the three-month rate of increase amounted to 137%. This month, however, imported crude petroleum prices already are down 14% from July.
Less petroleum, import prices rose the same 0.9% as they did during June. The 9.9% rate of price increase during the last three months was down somewhat from the recent peak rate of gain of 13.0%.
During
the last ten years there has been a 66% (negative) correlation between
the nominal trade-weighted exchange value of the US dollar vs. major
currencies and the y/y change in non oil import prices. The correlation
is a reduced 47% against a broader basket of currencies.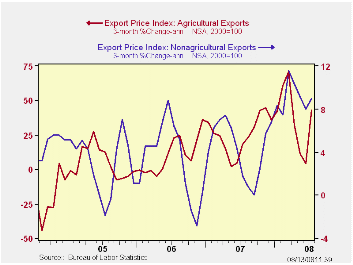
Prices for industrial supplies & materials excluding oil jumped again in July. The 2.2% surge and the three-month rate of increase of 34.9% (AR) reflected strength in building materials, unfinished metals, chemicals and agricultural prices. These detailed import price series can be found in the Haver USINT database.
Capital goods import prices rose 0.3% after a downwardly revised 0.1% dip in June. The three-month rate of gain of 2.2% was up from last year's low, but down from this spring's highs. Less the lower prices of computers, capital goods prices rose 0.8% and at a 5.6% rate during the last three months. They rose 2.7% last year. Prices of computers, peripherals & accessories fell 0.8% last month and they have been falling at a 6.7% recently, after the 5.1% 2007 decline.
Finally, prices for nonauto consumer goods imports rose 0.3% last month. Here again, the 2.3% rate of increase during the last three months is down from the peak rates of gain earlier this year. The diminished rate of increase for durables of 2.8% is notable.
Total export prices surged again, last month by 1.4% as agricultural prices jumped another 6.7% (39.9% y/y). Nonagricultural export prices rose 0.8% (7.5% y/y), about the same as they did in June.
| Import/Export Prices (NSA) | July | June | Y/Y | 2007 | 2006 | 2005 |
|---|---|---|---|---|---|---|
| Import - All Commodities | 1.7% | 2.9% | 21.6% | 4.2% | 4.9% | 7.5% |
| Petroleum | 4.0% | 8.9% | 79.2% | 11.6% | 20.6% | 37.6% |
| Non-petroleum | 0.9% | 0.9% | 8.0% | 2.7% | 1.7% | 2.7% |
| Export- All Commodities | 1.4% | 1.0% | 10.2% | 4.9% | 3.6% | 3.2% |
by Tom Moeller August 13, 2008
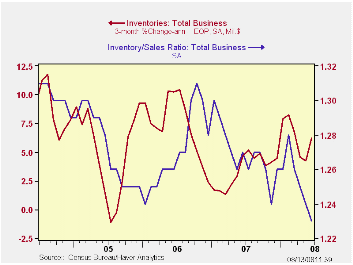
Total business inventories jumped 0.7% during June after an upwardly revised 0.4% May increase. The latest increase exceeded Consensus expectations for a 0.5% rise and it was the strongest gain since January. The three-month growth in inventories rose to 6.2% (AR) from roughly 4% during the prior two months.
Higher wholesale inventories led the gain the total with a 1.1% jump during June and at a 14.1% rate during the last three months, again boosted by the rise in oil prices. Nevertheless, less petroleum wholesale inventories rose at a 12.0% rate during those three months which was more than twice the rate of increase during all of last year.
Retail inventories fell 0.1% after a revised 0.3% May decline. The drops left the three-month growth rate negative at -0.5% reflecting the draw-down of automobile inventories. Inventories of motor vehicle & parts fell at a 6.2% annual rate during the last three months due to further production cutbacks. Outside of autos, retail inventories rose at a 2.2% rate over the last three months and that reversed three months of decumulation.
The industry detail in the retail sector indicated that lower apparel inventories led the recent weakness in the total with a 0.9% rate of decline. Furniture inventories rose at a 3.9% rate during the last three months and general merchandise inventories rose at a 2.3% rate. Both of these gains reverse prior declines. Clothing & accessory store inventories still fell at a 0.9% rate over the last three months after an 8.1% rate of decline back in March.
Factory inventories jumped 1.0% and that left the three-month rate of accumulation steady at 6.4%.
Total business sales jumped another 1.7% led higher by the rise in oil prices which lifted factory sales by 1.6%.
| Business Inventories | June | May | Y/Y | 2007 | 2006 | 2005 |
|---|---|---|---|---|---|---|
| Total | 0.7% | 0.4% | 5.6% | 3.8% | 5.9% | 6.0% |
| Retail | -0.1% | -0.3% | 0.9% | 2.6% | 3.5% | 2.3% |
| Retail excl. Auto | 0.1% | -0.1% | 1.3% | 2.7% | 4.9% | 3.9% |
| Wholesale | 1.1% | 0.9% | 9.5% | 5.5% | 8.3% | 7.3% |
| Manufacturing | 1.0% | 0.6% | 7.0% | 3.7% | 6.4% | 8.9% |
by Robert Brusca August 13, 2008
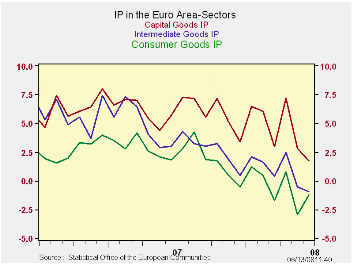
EMU IP came up flat in June but the declining trends are
clear. Capital goods output, consumer goods output and intermediate
goods output all are on declining profiles. Among large EU/EMU
countries Germany is the main exception that helps to prop up output in
the month. Elsewhere the results were much worse on the month. The
weakness in IP mirrors the weakness in order growth. Nonetheless, in
Germany Bert Ruerup, the head of the council of wise men, is opposed to
any German stimulus plan. Of course Germany is still best performing of
the EMU large economies.
Incoming EMU data continue to show weakness of various sorts.
It fits with a picture of global slowing. UK claims data today showed
the greatest gain in job market claimant activity in 15 years. In Japan
authorities are very worried about export growth. Flat IP in EMU seems
a sure bet to give way to declining IP and that will pose a threat to
US export growth that is still performing so well, as we saw in the US
trade report from yesterday. Everyone is linked and the disease of
weaker growth is still spreading.
| E-zone MFG IP | ||||||||||
|---|---|---|---|---|---|---|---|---|---|---|
| Saar except m/m | Mo/Mo | Jun 08 |
May 08 |
Jun 08 |
May 08 |
Jun 08 |
May 08 |
|||
| Euro Area Detail | Jun 08 |
May 08 |
Apr 08 |
3Mo | 3Mo | 6mo | 6mo | 12mo | 12mo | Q-2 Date |
| MFG | 0.0% | -1.4% | 0.4% | -4.0% | -6.6% | -1.2% | -0.9% | -0.1% | -0.1% | -3.9% |
| Consumer | 0.8% | -2.0% | 0.9% | -1.4% | -7.8% | -1.7% | -3.2% | -1.2% | -2.9% | -3.7% |
| Consumer Durables | -0.1% | -3.2% | 1.9% | -5.9% | -12.2% | -3.5% | -3.8% | -5.1% | -5.1% | -- |
| Consumer Non-Durables | 0.9% | -1.4% | 0.2% | -1.1% | -7.0% | -1.4% | -2.9% | -0.4% | -2.4% | -- |
| Intermediate | -0.2% | -1.5% | 0.3% | -5.1% | -6.6% | -2.0% | -0.5% | -0.9% | -0.5% | -4.0% |
| Capital | -0.4% | -2.0% | 2.1% | -1.4% | -6.7% | 1.0% | 0.9% | 1.7% | 2.8% | -1.7% |
| Main E-zone Countries and UK IP in MFG | ||||||||||
| Mo/Mo | Jun 08 |
May 08 |
Jun 08 |
May 08 |
Jun 08 |
May 08 |
||||
| MFG Only | Jun 08 |
May 08 |
Apr 08 |
3Mo | 3Mo | 6mo | 6mo | 12mo | 12mo | Q-2 Date |
| Germany | 0.5% | -1.9% | -0.3% | -6.9% | -9.2% | -2.2% | -0.8% | 2.2% | 1.3% | -6.1% |
| France: IP excl Construction | -0.4% | -2.9% | 1.3% | -7.8% | -10.2% | -4.9% | -2.9% | -1.6% | -1.8% | -5.3% |
| Italy | 0.2% | -1.5% | 0.4% | -3.3% | -4.9% | 1.5% | 1.1% | -2.0% | -2.6% | -2.5% |
| Spain | -4.9% | -14.8% | 27.5% | 13.9% | -33.7% | -17.5% | -10.0% | -9.6% | -7.7% | 2.2% |
| UK | -0.5% | -0.6% | 0.0% | -4.2% | -4.2% | -1.5% | -1.0% | -1.3% | -0.9% | -2.9% |
by Robert Brusca August 13, 2008
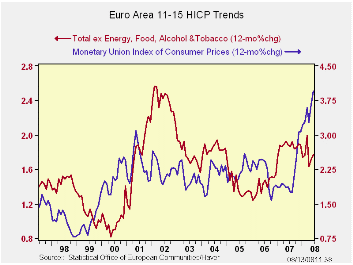
The inflation story in EMU/EU is clear but not uncomplicated.
Inflation at 4% Yr/Yr has accelerated in terms of its headline the only
measure the ECB claims to have designs on. But oil prices have dropped.
That should pave the way for better times ahead. Mover over, the core
rate of inflation is 2.5% Yr/Yr - still ‘too high’ - but its sequential
growth rates show that core inflation has been decelerating over the
recent 6-mos and three months. Moreover, this core deceleration is
observable across some key EMU countries including Italy.
The most troublesome inflation patterns are in the UK. The BOE
has the same 2% inflation ceiling as the ECB. But its headline Yr/Yr
inflation rate is at 7.3% and really accelerating. Core UK inflation
also is blowing up at a 2.2% rate Yr/Yr, 2.9% over six months and 3.9%
over three months.
The breakdown in global oil prices is good news for all
central banks, but the ECB is still in a bit of an inflation fix. The
ECB is getting in a more nettlesome position since its economy is
starting to show more pronounced weakness as core inflation abates. It
challenge – one it has not faced yet -- might be how to deal with
fading but still over-the-top inflation as growth begins to unwind more
sharply.
| Trends in HICP | |||||||
|---|---|---|---|---|---|---|---|
| % mo/mo | % SAAR | ||||||
| Jun-08 | May-08 | Apr-08 | 3-Mo | 6-Mo | 12-Mo | Yr Ago | |
| EMU-13 | 0.5% | 0.6% | 0.0% | 4.1% | 4.1% | 4.0% | 1.9% |
| Core | 0.2% | 0.2% | -0.1% | 1.3% | 2.3% | 2.5% | 1.9% |
| Goods | 0.4% | 0.8% | 0.6% | 7.6% | 6.0% | 4.9% | 1.5% |
| Services | 0.3% | 0.4% | -0.1% | 2.2% | 2.5% | 2.5% | 2.6% |
| HICP | |||||||
| Germany | 0.5% | 0.6% | -0.4% | 2.7% | 3.2% | 3.4% | 2.0% |
| France | 0.5% | 0.5% | 0.1% | 4.5% | 4.0% | 4.0% | 1.3% |
| Italy | 0.6% | 0.4% | 0.0% | 4.2% | 4.6% | 4.0% | 1.9% |
| UK | 0.6% | 0.5% | 0.7% | 7.3% | 5.4% | 3.8% | 2.3% |
| Spain | 0.6% | 0.7% | -0.1% | 4.9% | 4.5% | 5.0% | 2.4% |
| Core excl FE&A | |||||||
| Germany | 0.1% | 0.3% | -0.5% | -0.4% | 0.8% | 1.8% | 2.1% |
| Italy | 0.4% | 0.2% | -0.1% | 1.9% | 3.1% | 3.0% | 1.9% |
| UK | 0.3% | 0.3% | 0.4% | 3.9% | 2.9% | 2.2% | 2.2% |
| Spain | 0.3% | 0.3% | -0.1% | 2.2% | 2.6% | 3.4% | 2.5% |
by Robert BruscaAugust 12, 2008
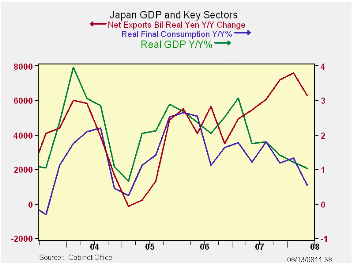
Officials in Japan have become more worried in recent weeks
even saying that they cannot be sure that the economy is not now in
recession. It’s GDP for 2008-Q2 tells that story. GDP is declining at a
weak 2.4% pace in Q2 (Saar). The Yr/Yr pace of GDP growth has slowed
from an already weak 1.4% in 2007-Q4 to 1.2% in 2008-Q1 and now to 1.0%
in 2008-Q2.
Private consumption is falling at a 1.9% pace. Gross fixed
capital formation is falling at a 6% rate. The investment rate for
capital equipment is -0.9% and for housing it’s a very weak -13%. Trade
is making a small subtraction from overall growth as imports are
dropping at better than a 10% rate as exports are falling at a nearly
9% ate. That results in a GDP subtraction because exports are so much
larger than imports in real terms than the smaller percentage decline
in exports is still a larger drop in real terms than the drop in
imports.
Moreover, domestic demand in Japan is falling at a 2.5% annual
rate in 2008-Q2 and is falling year/year for the second quarter in a
row. No wonder Japan’s authorities are concerned and stimulus package
is being prepared.
| Japan GDP | ||||||||||
|---|---|---|---|---|---|---|---|---|---|---|
| Consumption | Capital Formation | Trade | Domestic | |||||||
| GDP | Private | Public | Gross Fix Capital |
Plants &Eqpt |
Housing | X-M: lbns E |
Exports | Imports | Demand | |
| % change Q/Q at annual rates of change; X-M is Q/Q change in Bil Real Yen | ||||||||||
| Q2-08 | -2.4% | -1.9% | 0.3% | -6.0% | -0.9% | -13.0% | -0.4 | -8.9% | -10.7% | -2.5% |
| Q1-08 | 3.2% | 2.8% | -1.8% | 2.8% | -0.2% | 18.2% | 2.4 | 14.4% | 4.8% | 1.4% |
| Q4-07 | 2.4% | 1.4% | 3.4% | -2.5% | 4.3% | -33.8% | 1.9 | 11.1% | 3.3% | 1.0% |
| Q3-07 | 1.0% | 0.0% | 0.3% | -4.2% | 2.3% | -26.3% | 2.5 | 11.0% | -1.2% | -1.0% |
| % change Yr/Yr; X-M is Yr/Yr change in Gap in Bil Real Yen | ||||||||||
| Q2-08 | 1.0% | 0.5% | 0.5% | -2.6% | 1.3% | -15.8% | 6.3 | 6.5% | -1.2% | -0.3% |
| Q1-08 | 1.2% | 1.3% | 0.7% | -3.6% | -0.6% | -16.6% | 7.6 | 11.0% | 2.9% | -0.2% |
| Q4-07 | 1.4% | 1.2% | 1.4% | -3.8% | -0.2% | -21.5% | 7.2 | 10.4% | 2.3% | 0.0% |
| Q3-07 | 1.8% | 1.8% | 0.2% | -1.4% | 0.4% | -11.3% | 6.0 | 8.5% | 1.5% | 0.6% |
| 5-Yrs | 2.0% | 1.5% | 0.8% | 0.5% | 4.4% | -4.0% | na | 9.4% | 4.3% | 1.2% |

Tom Moeller
AuthorMore in Author Profile »Prior to joining Haver Analytics in 2000, Mr. Moeller worked as the Economist at Chancellor Capital Management from 1985 to 1999. There, he developed comprehensive economic forecasts and interpreted economic data for equity and fixed income portfolio managers. Also at Chancellor, Mr. Moeller worked as an equity analyst and was responsible for researching and rating companies in the economically sensitive automobile and housing industries for investment in Chancellor’s equity portfolio. Prior to joining Chancellor, Mr. Moeller was an Economist at Citibank from 1979 to 1984. He also analyzed pricing behavior in the metals industry for the Council on Wage and Price Stability in Washington, D.C. In 1999, Mr. Moeller received the award for most accurate forecast from the Forecasters' Club of New York. From 1990 to 1992 he was President of the New York Association for Business Economists. Mr. Moeller earned an M.B.A. in Finance from Fordham University, where he graduated in 1987. He holds a Bachelor of Arts in Economics from George Washington University.
More Economy in Brief


