 Global| May 01 2008
U.S. Real DPI Flat in March, Trend Growth Reduced
by:Tom Moeller
|in:Economy in Brief
Summary
Disposable personal income grew 0.3% in March, but adjusted for a 0.3% increase in prices, income was flat. During February, however, real income rose 0.3%. As a result, the 1.9% three month growth rate in real DPI was up slightly [...]
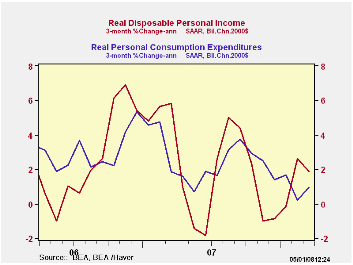
Disposable personal income grew 0.3% in March, but adjusted for a 0.3% increase in prices, income was flat. During February, however, real income rose 0.3%. As a result, the 1.9% three month growth rate in real DPI was up slightly from the negative growth during the end of last year, but still that was down from the 3.1% rise during all of 2006 and 2007.
Nominal personal income grew 0.3% during March which was slightly lower than the 0.4% Consensus expectation. The gain left the three-month growth in income at 4.4% which was down from the 6.2% rise during all of last year.
Wage & salary income rose 0.5% (3.3% y/y) after a 0.3%
February increase. Three month growth in wages amounted to 5.5% which
has been stable of late but well reduced from the 10% rates of growth
early in 2007 and late in 2006. Factory sector wages rose 0.3% (-0.2%
y/y), the same as in February, and wages & salaries in the
private service-providing industries rose 0.5% (3.6% y/y). These two
annual rates of growth are well off the growth rates posted during the
middle of 2007. Wages in the government sector rose 0.3% (5.0% y/y) and
three month growth rose to 7.4%. That was up from the 4.6% rise during
2007.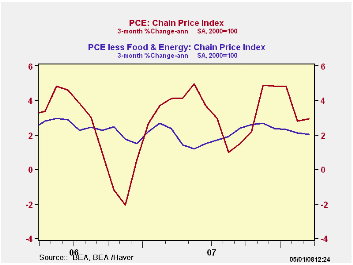
Lower interest rates caused the sixth straight monthly decline in interest income (+2.4% y/y) after a 5.0% gain last year and 8.0% growth during 2006. Dividend income rose another firm 0.6% (10.9% y/y), though that annual rate of growth is down from 13.8% last year and from 16.3% in 2006.
Personal consumption expenditures grew 0.4% during March though, when adjusted for price inflation, real spending rose just 0.1% and it grew at a 1.0% annual rate over the last three months. That's after 2.9% growth in 2007 and less than the 3.0% growth in each of the prior two years.
Real spending on discretionary items continued weak. Motor vehicle & parts purchases fell 0.5% last month and three month growth cratered to -10.3%. Real spending on household furniture & appliances fell 0.4% in March and three month growth was 0.2% after a 7.8% rise last year. Real spending on apparel increased 0.8% and three month growth actually picked up to 10.3% after an abysmal December last year. These and other detailed spending figures are available in Haver's USNA database.
The PCE chain price index rose 0.3% after the 0.1% uptick in February. The 0.2% rise in the core PCE price index beat expectations for a 0.1%. The three month growth in prices rose to 2.9% but that was up slightly from 2.5% in 2007 and 2.8% in 2006. The core price index rose 0.2% but the three month rate of growth fell slightly to 2.0% from 2.1% last year and 2.2% in 2006.
The personal savings rate remained barely positive at 0.2%, down just a bit from prior years.
| Disposition of Personal Income (%) | March | February | Y/Y | 2007 | 2006 | 2005 |
|---|---|---|---|---|---|---|
| Personal Income | 0.3 | 0.5 | 4.0 | 6.2 | 6.6 | 5.9 |
| Disposable Personal Income | 0.3 | 0.5 | 4.1 | 5.7 | 5.9 | 4.7 |
| Personal Consumption | 0.4 | 0.1 | 5.3% | 5.5 | 5.9 | 6.2 |
| Saving Rate | 0.2 | 0.4 | 1.5 (Mar. 07) | 0.4 | 0.4 | 0.5 |
| PCE Chain Price Index | 0.3 | 0.1 | 3.2 | 2.5 | 2.8 | 2.9 |
| Less food & energy | 0.2 | 0.1 | 2.1 | 2.1 | 2.2 | 2.2 |
by Tom Moeller May 1, 2008
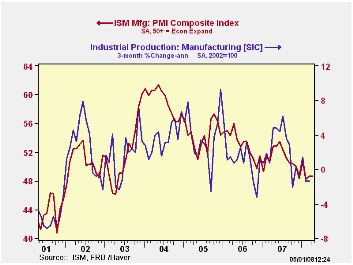
For April, the Institute of Supply Management (ISM) reported its Composite Index of Manufacturing Sector Activity remained unchanged from March at 48.6. That was slightly better than Consensus expectations for a decline to 48.0 but the index remained below the break even level for activity of 50 for the fourth month in the last five.
The index's average level of 49.0 so far this year was its lowest since early 2003.
During the last twenty years there has been a 64% correlation between the level of the Composite Index and the three month growth in factory sector industrial production.
It is appropriate to correlate the ISM index level
with factory sector growth because the ISM index
is a diffusion index. It measures growth by being constructed using all
of the absolute positive changes in activity added to one half of the
no change in activity measures.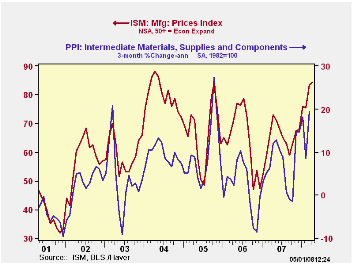
The new orders index also was unchanged m/m and remained below the break even level. It was near the lowest level since the recession year of 2001. Production rose very slightly but remained low at 49.1. The inventory component rose sharply to its highest level since January.
The new export orders sub-series rose slightly to a better-than-break even 57.5 and so far this year it is up slightly from the last two years.
The employment index fell sharply m/m to 45.4 which was its lowest level since mid 2003. During the last twenty years there has been a 67% correlation between the level of the ISM employment Index and the three month growth in factory sector employment.
The prices paid index surged to its highest level since early 2004. During the last twenty years there has been a 77% correlation between the price index and the three month change in the PPI for intermediate goods.
| ISM Mfg | April | March | April '07 | 2007 | 2006 | 2005 |
|---|---|---|---|---|---|---|
| Composite Index | 48.6 | 48.6 | 52.8 | 51.1 | 53.1 | 54.4 |
| New Orders Index | 46.5 | 46.5 | 58.1 | 54.3 | 55.4 | 57.4 |
| Employment Index | 45.4 | 49.2 | 52.3 | 50.5 | 51.7 | 53.6 |
| Prices Paid Index (NSA) | 84.5 | 83.5 | 73.0 | 64.6 | 65.0 | 66.4 |
by Tom Moeller May 1, 2008
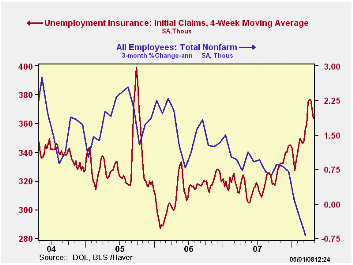
Initial claims for unemployment insurance claims reversed the prior period's decline and rose 35,000 last week to 380,000. Consensus expectations had been for claims to total 360,000 last week.
The four week moving average of initial claims, however, fell
to 363,750 (13.1% y/y), its lowest level in over a month.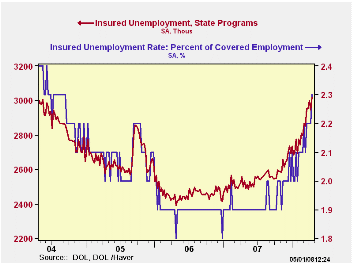
A claims level below 400,000 typically has been associated with growth in nonfarm payrolls. During the last ten years there has been a (negative) 76% correlation between the level of initial claims and the m/m change in nonfarm payroll employment.
Continuing claims for unemployment insurance rose 74,000 and also reversed the prior week's decline. The latest level was its highest since early 2004 and it provides some indication of workers' ability to find employment.
The continuing claims numbers lag the initial claims figures by one week.
The insured rate of unemployment rose to 2.3% after four weeks at 2.2%. The latest also was the highest since 2004.
| Unemployment Insurance (000s) | 04/25/08 | 04/18/08 | Y/Y | 2007 | 2006 | 2005 |
|---|---|---|---|---|---|---|
| Initial Claims | 380 | 345 | 23.0% | 322 | 313 | 331 |
| Continuing Claims | -- | 3,019 | 20.9% | 2,552 | 2,459 | 2,662 |
by Tom Moeller May 1, 2008
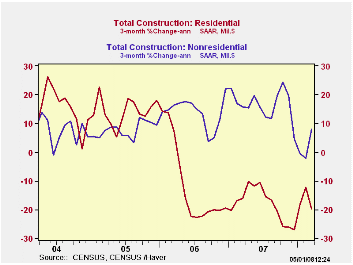
The value of construction put in place in March fell a more-than-expected 1.1% but February's level was revised up. The latest decline was the fifth in the last six months and the March level was 8.4% below the peak two years ago.
The value of residential building activity cratered 4.6% in March led by a 5.3% (-36.1% y/y) decline in building of single family units. That was similar to the decline in the prior several months. Building activity on multi-family units also slipped 0.5% (-17.0% y/y) and spending on improvements reversed nearly all of the prior month's jump and fell 4.8% (+10.4% y/y).
During the last twenty years there has been an 84% correlation
between the q/q change in the value of residential building and its
contribution to growth in real GDP.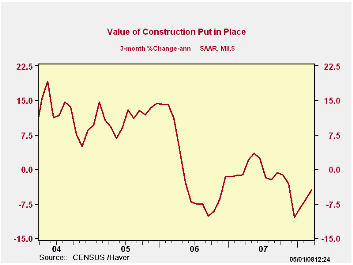
The value of nonresidential building activity jumped 1.9% but three month growth of 9.5% is down from an 18.0% rise last year. A decline in multi-retail building of 2.7% (AR) during the last three months compared with a 14.5% rise last year. A 1.6% 3-month gain in commercial building was down from 13.4% growth last year. Growth in office building remained firm at 13.3% versus 19.6% growth last year.
Growth in public construction over the last three months of 5.0% compared to a 12.2% rise last year. Construction on highways & streets rose at a 10.1% rate during the last three months after last year's rise of 7.4%. (The value of construction on highways & streets is nearly one third of the value of total public construction spending.) Building activity of educational facilities fell at a 3.8% rate after last year's 12.6% rise.
The more detailed categories of construction represent the Census Bureau’s reclassification of construction activity into end-use groups. Finer detail is available for many of the categories; for instance, commercial construction is shown for automotive sales and parking facilities, drugstores, building supply stores, and both commercial warehouses and mini-storage facilities. Note that start dates vary for some seasonally adjusted line items in 2000 and 2002 and that constant-dollar data are no longer computed.
Maps and data that illustrate subprime and alt-A mortgage loan conditions across the United States, from the Federal Reserve, can be found here.
| Construction | March | February | Y/Y | 2007 | 2006 | 2005 |
|---|---|---|---|---|---|---|
| Total | -1.1% | 0.4% | -3.4% | -2.7% | 5.6% | 10.7% |
| Private | -1.7% | 0.3% | -6.7% | -6.8% | 4.7% | 12.0% |
| Residential | -4.6% | 0.2% | -19.9% | -18.1% | 0.5% | 13.7% |
| Nonresidential | 1.9% | 0.6% | 15.4% | 18.0% | 15.2% | 7.8% |
| Public | 0.6% | 0.4% | 7.0% | 12.2% | 9.2% | 6.2% |
by Tom Moeller May 1, 2008
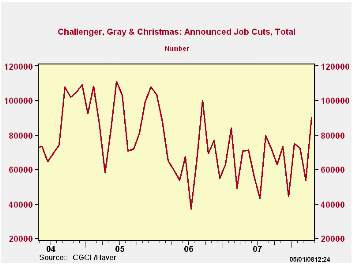
According to the Challenger, Grey & Christmas survey, job cut announcements in April surged to 90,015 from 53,579 in March. The three month average of announcements drifted to its highest level since November 2006.
The three month average of job cut announcements in services, consumer goods, and government sectors led the upward drift.
During the last ten years there has been a 76% (inverse) correlation between the three month moving average of announced job cuts and the three month change payroll employment.
Job cut announcements differ from layoffs. Many are achieved through attrition, early retirement or just never occur.
Challenger also reported that announced hiring plans rose sharply m/m but that the three month average was little changed.
| Challenger, Gray & Christmas | April | March | Y/Y | 2007 | 2006 | 2005 |
|---|---|---|---|---|---|---|
| Announced Job Cuts | 90,015 | 53,579 | 27.4% | 768,264 | 839,822 | 1,072,054 |
by Robert Brusca May 1, 2008
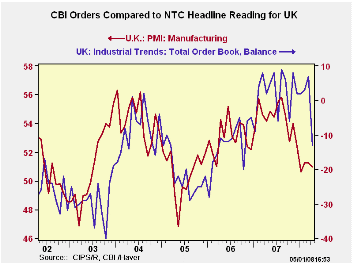
The NTC and CBI indices show that the UK MFG sector is on the
decline. The CBI industrial total orders reading is placed in its range
percentile at 55 the fifty-fifth percentile, nearly the same relative
position as for the overall NTC MFG index at 51 the fifty-first
percentile. Both indices have fallen sharply ‘recently although for the
NTC PMI index the drop came several months ago, while the CBI orders
series took its sharp drop just this month. There is some evidence that
suggests the NTC index has moved in advance of the CBI orders index in
the past. Note that while the two indices seem to track each other
fairly well, their respective ‘zero’ or neutral points do not match up
on this two scale chart. For the CBI neutral is at zero, for the NTC
report neutral is at 50. Looking at our ‘percentile of range
statistics’ gets us away from this sort of dilemma. We can se that the
CBI points to surging inflation on top of weakening growth.
| UK Industrial volume data CBI Survey | |||||||||
|---|---|---|---|---|---|---|---|---|---|
| Reported: | Apr-08 | Mar-08 | Feb-08 | Jan-08 | 12Mo Avg | Pcntle | Max | Min | Range |
| Total Orders | -13 | 7 | 3 | 2 | 2 | 55% | 9 | -40 | 49 |
| Export Orders | -12 | 3 | -8 | -4 | -4 | 72% | 3 | -50 | 53 |
| Stocks: Final Goods | 12 | 12 | 11 | 7 | 9 | 50% | 26 | -2 | 28 |
| Output Volume: Next 3M | 11 | 18 | 11 | 9 | 12 | 70% | 28 | -28 | 56 |
| Avg Prices for next 3M | 25 | 25 | 22 | 21 | 19 | 100% | 25 | -30 | 55 |
| From end 2000 | |||||||||
| Compare to CIPS MFG | |||||||||
| Apr-08 | Mar-08 | Feb-08 | Jan-08 | 12 Mo Avg | Pcntle | Max | Min | Range | |
| UK MFG | 50.96 | 51.25 | 51.24 | 50.60 | 53.18 | 51% | 56.32 | 45.46 | 11 |

Tom Moeller
AuthorMore in Author Profile »Prior to joining Haver Analytics in 2000, Mr. Moeller worked as the Economist at Chancellor Capital Management from 1985 to 1999. There, he developed comprehensive economic forecasts and interpreted economic data for equity and fixed income portfolio managers. Also at Chancellor, Mr. Moeller worked as an equity analyst and was responsible for researching and rating companies in the economically sensitive automobile and housing industries for investment in Chancellor’s equity portfolio. Prior to joining Chancellor, Mr. Moeller was an Economist at Citibank from 1979 to 1984. He also analyzed pricing behavior in the metals industry for the Council on Wage and Price Stability in Washington, D.C. In 1999, Mr. Moeller received the award for most accurate forecast from the Forecasters' Club of New York. From 1990 to 1992 he was President of the New York Association for Business Economists. Mr. Moeller earned an M.B.A. in Finance from Fordham University, where he graduated in 1987. He holds a Bachelor of Arts in Economics from George Washington University.
More Economy in Brief


