 Global| May 05 2005
U.S. Productivity Slightly Higher Than Expected
by:Tom Moeller
|in:Economy in Brief
Summary
In 1Q05, non-farm labor productivity rose 2.6% versus Consensus expectations for a 1.9% gain. The gain was the quickest in three quarters yet growth year to year slowed to 2.5% from its peak of 5.5% early last year. The surprise [...]
In 1Q05, non-farm labor productivity rose 2.6% versus Consensus expectations for a 1.9% gain. The gain was the quickest in three quarters yet growth year to year slowed to 2.5% from its peak of 5.5% early last year.
The surprise stemmed from a slowdown in hours worked to 1.0% (1.4% y/y) versus 1.6% in 4Q and 2.8% growth in 3Q04. Output growth of 3.6% compared to 5.3% during all of 2004.
Unit labor costs accelerated to 2.2% versus annual growth of 0.4% last year. Compensation costs held steady at a strong 4.8% versus 4.5% growth during 2004.
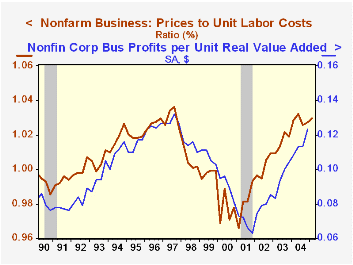
A 2.9% rise in the implicit price deflator raised slightly the ratio of prices to unit labor costs, suggesting that profit margins remained firm.
Does Wage Inflation Cause Price Inflation? from the Federal Reserve Bank of Cleveland can be found here. 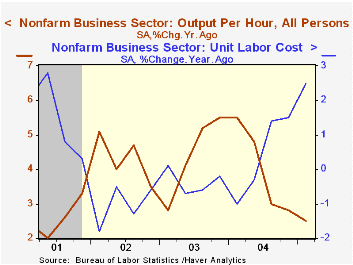
| Non-farm Business Sector (SAAR) | 1Q '05 | 4Q '04 | Y/Y | 2004 | 2003 | 2002 |
|---|---|---|---|---|---|---|
| Output per Hour | 2.6% | 2.1% | 2.5% | 4.1% | 4.4% | 4.3% |
| Compensation | 4.8% | 3.8% | 5.0% | 4.5% | 4.0% | 3.2% |
| Unit Labor Costs | 2.2% | 1.7% | 2.5% | 0.4% | -0.4% | -1.1% |
by Tom Moeller May 5, 2005
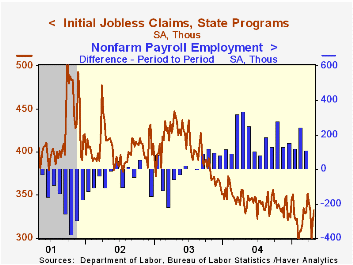
Initial claims for unemployment insurance rose further last week. The 11,000 increase to 333,000 followed an upwardly revised gain of 23,000 the week prior. Consensus expectations had been for 325,000 claims.
During the last ten years there has been a (negative) 75% correlation between the level of initial claims for unemployment insurance and the monthly change in payroll employment. There has been a (negative) 65% correlation with the level of continuing claims.
The four week moving average of initial claims nevertheless fell to 321,500 (-6.9% y/y).
Continuing claims for unemployment insurance gained back 38,000 of a deepened 80,000 drop the prior week.
The insured unemployment rate held at 2.0%.
| Unemployment Insurance (000s) | 04/30/05 | 04/23/05 | Y/Y | 2004 | 2003 | 2002 |
|---|---|---|---|---|---|---|
| Initial Claims | 333 | 322 | 1.2% | 343 | 402 | 404 |
| Continuing Claims | -- | 2,589 | -11.7% | 2,926 | 3,531 | 3,570 |
by Carol Stone May 5, 2005
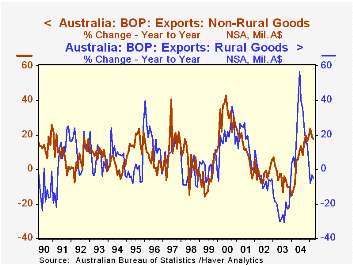
The Australian trade deficit widened distinctly in March. The A$2.7 billion gap, reported today by the Australian Bureau of Statistics, is the second largest monthly shortfall ever. In this latest month, both exports and imports moved adversely, with exports down 1.5% and imports up 3.3% from February.
At the same time, longer comparisons suggest that March's trade deficit widening, and the dip in exports in particular, is perhaps not representative of current trends. Exports, in fact, have expanded 12.4% over the past year, encompassing a 17.6% advance in "non-rural goods" shipments. These products appear quite vigorous, recovering markedly from a decline during 2003. Agricultural items, in contrast, have undergone extraordinarily wide cycles in the last several years, and have become less reliable as a prop to the Australian economy.
Imports, as in many countries, are being impacted by the rising cost of energy products, reflected here in the "intermediate goods" line item. Consumers continue to buy foreign products, while demand for capital goods from abroad is beginning to show signs of hesitation. This latter is notable, for, as seen in the second graph, imports of capital goods closely parallel the national accounts measure of investment in machinery and equipment. So the downturn in these imports in the opening months of 2005 may suggest slower investment demand in general in Australia.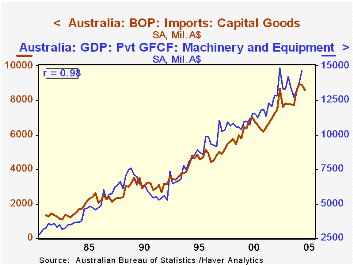
| Australia | Mar 2005 | Feb 2005 | Year Ago | 2004 | 2003 | 2002 |
|---|---|---|---|---|---|---|
| Balance on Goods & Services | -2,672 | -2,238 | -2,098 | -25,434 | -23,749 | -10,325 |
| Exports of Goods | 10,151 | 10,302 | 8,870 | 118,427 | 108,321 | 119,478 |
| Rural Goods | 1,904 | 2,075 | 2,003 | 26,925 | 22,357 | 28,866 |
| Non-rural Goods | 8,247 | 8,227 | 6,867 | 91,502 | 85,967 | 90,612 |
| Imports of Goods | 12,910 | 12,501 | 10,921 | 142,739 | 131,656 | 129,468 |
| Consumer Goods | 4,070 | 4,054 | 3,579 | 45,304 | 41,397 | 39,931 |
| Capital Goods | 2,838 | 2,949 | 2,599 | 34,417 | 31,032 | 303,79 |
| Intermediate & Other Goods | 6,002 | 5,499 | 4,743 | 63,018 | 59,227 | 59,158 |

Tom Moeller
AuthorMore in Author Profile »Prior to joining Haver Analytics in 2000, Mr. Moeller worked as the Economist at Chancellor Capital Management from 1985 to 1999. There, he developed comprehensive economic forecasts and interpreted economic data for equity and fixed income portfolio managers. Also at Chancellor, Mr. Moeller worked as an equity analyst and was responsible for researching and rating companies in the economically sensitive automobile and housing industries for investment in Chancellor’s equity portfolio. Prior to joining Chancellor, Mr. Moeller was an Economist at Citibank from 1979 to 1984. He also analyzed pricing behavior in the metals industry for the Council on Wage and Price Stability in Washington, D.C. In 1999, Mr. Moeller received the award for most accurate forecast from the Forecasters' Club of New York. From 1990 to 1992 he was President of the New York Association for Business Economists. Mr. Moeller earned an M.B.A. in Finance from Fordham University, where he graduated in 1987. He holds a Bachelor of Arts in Economics from George Washington University.
More Economy in Brief


