 Global| Feb 03 2005
U.S. Productivity Growth Slowed Sharply
by:Tom Moeller
|in:Economy in Brief
Summary
Growth in 4Q '04 non-farm labor productivity slowed sharply to 0.8% from 1.8% growth the prior quarter. Consensus expectations had been for 2.0% growth. For the full year, growth of 4.1% was the lowest since 2001. Pending upward [...]
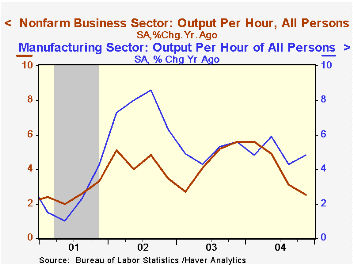
Growth in 4Q '04 non-farm labor productivity slowed sharply to 0.8% from 1.8% growth the prior quarter. Consensus expectations had been for 2.0% growth. For the full year, growth of 4.1% was the lowest since 2001.
Pending upward revisions to GDP growth due to raised estimates of exports (to Canada) likely will result in an upward revision to this preliminary estimate.
Slower output growth of 2.8% (4.2% y/y) versus 4.2% growth in 3Q caused the slowdown. That was partially offset by hours worked which slowed to 1.9% growth from 2.4%.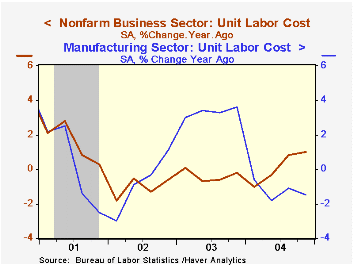
Unit labor costs grew 2.3%, the fastest since 2Q '02, though compensation growth slowed to 3.1% (3.6% y/y).
Productivity in the manufacturing sector improved to 5.6% (4.8% y/y) versus 4.2% growth in 3Q. Unit labor cost growth in the factory sector was about stable at 0.4% (-1.5% y/y).
| Non-farm Business Sector (SAAR) | 4Q '04 | 3Q '04 | Y/Y | 2004 | 2003 | 2002 |
|---|---|---|---|---|---|---|
| Output per Hour | 0.8% | 1.8% | 2.5% | 4.1% | 4.4% | 4.4% |
| Compensation | 3.1% | 3.5% | 3.6% | 4.2% | 4.1% | 3.3% |
| Unit Labor Costs | 2.3% | 1.6% | 1.0% | 0.1% | -0.4% | -1.1% |
by Tom Moeller February 3, 2005
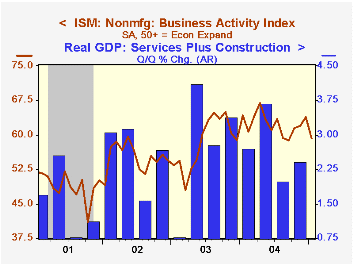
The Business Activity Index for the non-manufacturing sector fell in January to 59.2 following three consecutive months of increase according to the Institute for Supply Management. Consensus expectations had been for less of a decline to 61.0.
Since the series' inception in 1997 there has been a 55% correlation between the Business Activity Index and the q/q change in GDP services plus construction.
The new orders index reversed most of the prior month's rise and fell to 60.5. That was below the 61.8 averaged last year.
The employment sub index fell sharply to the lowest level since July. Since the series' inception in 1997 there has been a 60% correlation between the level of the ISM non-manufacturing employment index and the m/m change in payroll employment in the service producing plus the construction industries.
Pricing power eased considerably as indicated by a 7.0 point decline in the index to the lowest level in nearly a year.
ISM surveys more than 370 purchasing managers in more than 62 industries including construction, law firms, hospitals, government and retailers. The non-manufacturing survey dates only to July 1997, therefore its seasonal adjustment should be viewed tentatively.Business Activity Index for the non-manufacturing sector reflects a question separate from the subgroups mentioned above. In contrast, the NAPM manufacturing sector composite index is a weighted average five components.
| ISM Nonmanufacturing Survey | Jan | Dec | Jan '04 | 2004 | 2003 | 2002 |
|---|---|---|---|---|---|---|
| Business Activity Index | 59.2 | 63.9 | 64.2 | 62.4 | 58.2 | 55.1 |
| Prices Index | 66.6 | 73.6 | 60.8 | 69.0 | 56.8 | 54.0 |
by Tom Moeller February 3, 2005
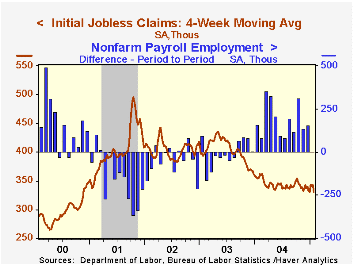
Initial claims for unemployment insurance fell 9,000 to 316,000 last week, reversed the unrevised 7,000 increase during the prior week and landed just above the lowest levels since early 2001. Consensus expectations had been for a larger increase to 330,000 claims.
The four week moving average of initial claims fell to 331,500 (-6.8% y/y).
During the last ten years there has been a (negative) 82% correlation between the level of initial claims and the y/y change in payroll employment.
Continuing claims for unemployment insurance declined 116,000 and reversed all of the downwardly revised gain the prior week.
The insured rate of unemployment fell back to the four year low of 2.1%.
| Unemployment Insurance (000s) | 01/29/05 | 01/22/05 | Y/Y | 2004 | 2003 | 2002 |
|---|---|---|---|---|---|---|
| Initial Claims | 316 | 325 | -13.7% | 343 | 402 | 404 |
| Continuing Claims | -- | 2,696 | -15.1% | 2,926 | 3,531 | 3,570 |
by Tom Moeller February 3, 2005
Shipments from the US factory sector rose 0.9% in December, capping off a year of 10.4% growth which was the strongest in twenty years. Some of that strength is exaggerated by a 38.0% jump in shipments from petroleum refineries, but less oil factory shipments still rose a robust 8.8%.
Orders to the factory sector added 0.3% in December to the 1.4% spike the prior month and for the year surged 10.8%. Less oil orders rose 9.2% last year. The advance report of a 0.6% gain in durable goods orders in December was revised to 1.1% (9.3% y/y) as the increase in nondefense capital goods orders less aircraft was revised up to 2.5% from 1.8%.
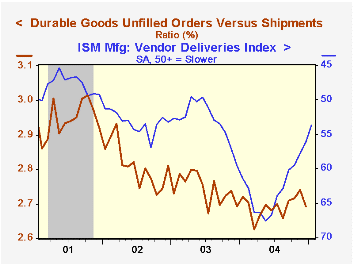
Unfilled orders added 0.6% to the 1.1% jump in November. Supply bottlenecks perhaps eased slightly as indicated by a lower ratio of unfilled orders to shipments for durables, however the ISM index of vendor performance showed slower delivery speeds.
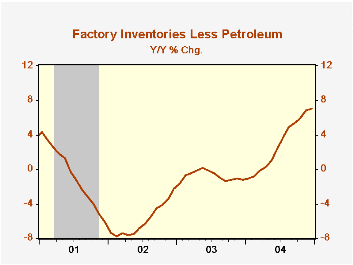
Factory inventories fell 0.1% in December led down by a 9.1% (+15.2% y/y) drop in petroleum inventories. Less petroleum, inventories rose 0.3% (7.0% y/y) following a 0.9% increase in November.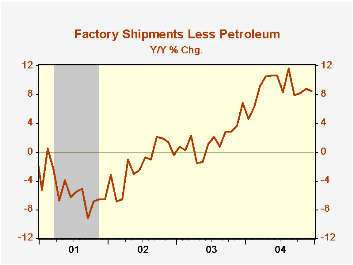
| Factory Survey (NAICS) | Dec | Nov | Y/Y | 2004 | 2003 | 2002 |
|---|---|---|---|---|---|---|
| Inventories | -0.1% | 1.0% | 7.3% | 7.3% | -1.3% | -1.8% |
| New Orders | 0.3% | 1.4% | 9.9% | 10.8% | 3.7% | -1.9% |
| Shipments | 0.9% | 0.4% | 9.8% | 10.4% | 2.6% | -2.0% |
| Unfilled Orders | 0.6% | 1.1% | 9.1% | 9.1% | 4.2% | -6.1% |

Tom Moeller
AuthorMore in Author Profile »Prior to joining Haver Analytics in 2000, Mr. Moeller worked as the Economist at Chancellor Capital Management from 1985 to 1999. There, he developed comprehensive economic forecasts and interpreted economic data for equity and fixed income portfolio managers. Also at Chancellor, Mr. Moeller worked as an equity analyst and was responsible for researching and rating companies in the economically sensitive automobile and housing industries for investment in Chancellor’s equity portfolio. Prior to joining Chancellor, Mr. Moeller was an Economist at Citibank from 1979 to 1984. He also analyzed pricing behavior in the metals industry for the Council on Wage and Price Stability in Washington, D.C. In 1999, Mr. Moeller received the award for most accurate forecast from the Forecasters' Club of New York. From 1990 to 1992 he was President of the New York Association for Business Economists. Mr. Moeller earned an M.B.A. in Finance from Fordham University, where he graduated in 1987. He holds a Bachelor of Arts in Economics from George Washington University.
More Economy in Brief


