 Global| May 07 2008
U.S. Productivity Growth Firm, Unit Labor Costs Contained
by:Tom Moeller
|in:Economy in Brief
Summary
Nonfarm labor productivity rose 2.2% last quarter after 1.8% growth during 4Q07. The latest gain was slightly stronger than the expected 1.8% figure and at 3.2%, the year- to- year rise in productivity was the firmest since early [...]
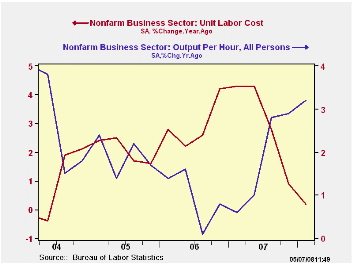
Nonfarm labor productivity rose 2.2% last quarter after 1.8% growth during 4Q07. The latest gain was slightly stronger than the expected 1.8% figure and at 3.2%, the year- to- year rise in productivity was the firmest since early 2004.
Productivity's strength stemmed from a 1.8% (-0.6% y/y) decline in total hours worked which was the fourth decline in the last five quarters. That decline was accompanied by a 0.4% (2.6% y/y) rise in output which was hardly improved from the 0.2% increase during 4Q07.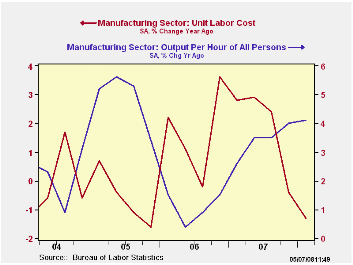
Compensation per hour rose a firm 4.4% rate last quarter. The year- to- year growth decelerated, however, to 3.4% from 4.9% during all of last year. Outsized quarterly growth in compensation late in '06 and early in '07, between 6% and 12%, drove the growth in 2007 compensation up.
Unit labor costs growth was contained, as a result of the firm productivity gain, to 2.2% versus 2.8% growth during 4Q'07. Year- to- year, the growth in costs fell to a meager 0.2%, the slowest rate of growth since a slight decline early in 2004. Unit nonlabor payments (which account for roughly one third of total costs) did rise 2.2% (3.5% y/y) after a slight decline in 4Q.
In the factory sector, productivity rose at a steady 4.1% (4.1% y/y) rate. Unit labor costs did rise 2.5% on a quarterly basis but earlier quarterly declines held the annual change to a negative -1.3%.
Productivity, Energy Prices, and the Great Moderation: a New Link is from the Federal Reserve Bank of Atlanta and it can be found here .
| Nonfarm Business Sector (SAAR, %) | Q1 '08 | Q4 '07 | Y/Y | 2007 | 2006 | 2005 |
|---|---|---|---|---|---|---|
| Output per Hour | 2.2 | 1.8 | 3.2 | 1.8 | 1.0 | 1.9 |
| Compensation per Hour | 4.4 | 4.6 | 3.4 | 4.9 | 3.9 | 4.0 |
| Unit Labor Costs | 2.2 | 2.8 | 0.2 | 3.1 | 2.9 | 2.0 |
by Tom Moeller May 7, 2008
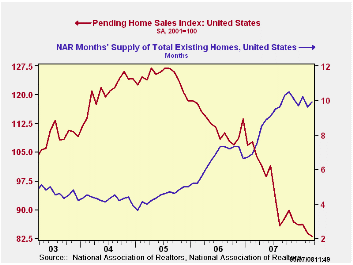
The National Association of Realtors reported that the level of pending sales of existing homes fell an expected 1.0% after a deepened 2.8% February decline. Sales during 1Q08 were down 11.9% from the average sales level in 2007.
These figures are analogous to the new home sales data from the Commerce Department in that they measure existing home sales when the sales contract is signed, not at the time the sale is closed.
Sales in the West fell by 1.4% for the second month following a 13.0% spurt in January. That improvement was accompanied by a 12.5% surge in sales in the Northeast. Sales in the South ticked lower by 0.1% but sales are down 38.8% from their 2005 peak. In the Midwest March sales collapsed 10.4% m/m after a 3.7% February drop.
The Realtors also indicated in an earlier report that the number of homes on the market & available for sale rose 1.0% in March (6.6% y/y). At the current sales rate there was a 9.9 months' supply of homes on the market versus an 8.9 months' average during all of last year, a 6.5 months' supply in 2006 and a 4.5 months' supply in 2005.
The pending home sales data are available in Haver's PREALTOR database and the number of homes on the market are in the REALTOR database.
| Pending Home Sales (2001=100) | March | February | Y/Y | 2007 | 2006 | 2005 |
|---|---|---|---|---|---|---|
| Total | 83.0 | 83.8 | -20.1% | 95.7 | 112.1 | 124.3 |
| Northeast | 80.8 | 71.8 | -15.4 | 85.6 | 98.5 | 108.3 |
| Midwest | 74.1 | 82.7 | -22.3 | 89.6 | 102.0 | 116.4 |
| South | 84.9 | 85.0 | -26.8 | 107.3 | 127.3 | 134.8 |
| West | 91.2 | 92.5 | -9.4 | 92.1 | 109.5 | 128.6 |

Tom Moeller
AuthorMore in Author Profile »Prior to joining Haver Analytics in 2000, Mr. Moeller worked as the Economist at Chancellor Capital Management from 1985 to 1999. There, he developed comprehensive economic forecasts and interpreted economic data for equity and fixed income portfolio managers. Also at Chancellor, Mr. Moeller worked as an equity analyst and was responsible for researching and rating companies in the economically sensitive automobile and housing industries for investment in Chancellor’s equity portfolio. Prior to joining Chancellor, Mr. Moeller was an Economist at Citibank from 1979 to 1984. He also analyzed pricing behavior in the metals industry for the Council on Wage and Price Stability in Washington, D.C. In 1999, Mr. Moeller received the award for most accurate forecast from the Forecasters' Club of New York. From 1990 to 1992 he was President of the New York Association for Business Economists. Mr. Moeller earned an M.B.A. in Finance from Fordham University, where he graduated in 1987. He holds a Bachelor of Arts in Economics from George Washington University.
More Economy in Brief


