 Global| Feb 06 2008
U.S. Productivity Down in Q4 But Up for All of 2007; Factory Sector Costs Up
by:Tom Moeller
|in:Economy in Brief
Summary
Nonfarm labor productivity growth last quarter slowed considerably to 1.8% from a little revised 6.0% during 3Q07. The preliminary 4Q figure beat Consensus expectations for a 0.5% rise. Despite the 4Q slowdown, productivity growth of [...]
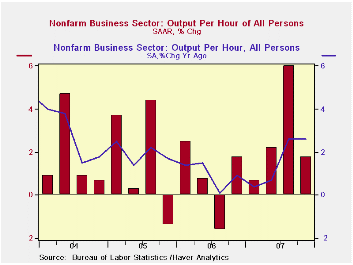
Nonfarm labor productivity growth last quarter slowed considerably to 1.8% from a little revised 6.0% during 3Q07. The preliminary 4Q figure beat Consensus expectations for a 0.5% rise. Despite the 4Q slowdown, productivity growth of 1.6% for all of last year was up from the measly 1.0% rate during 2006 due to that 6.0% 3Q spurt.
Output growth last quarter did indeed decelerate sharply to
just 0.4% from 5.6% during 3Q but a decline in hours worked to a 1.5%
rate of decline was the sharpest fall of three during 2007. For all of
last year hours worked rose 0.7% y/y.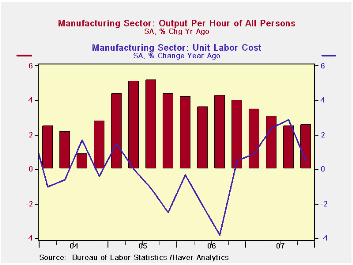
Compensation per hour last quarter held roughly steady with 3Q at a 3.9% rate of growth. Despite that stability compensation growth for the year accelerated to a 4.8% rate of growth which was the quickest since 2000.
That stability of compensation in the face of slower
productivity raised unit labor cost growth to 2.1%
from its 3Q decline by a like amount. The Consensus expectation had
been for 3.5% growth in unit labor costs. The 4Q rise was enough to
lift the gain in labor costs for the full year by 3.1% That was
slightly ahead of the 2006 increase but it also was the quickest since
2000.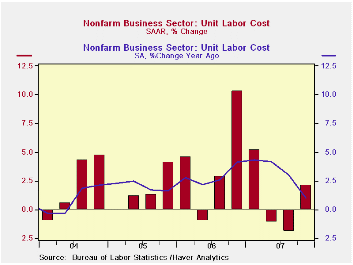
Productivity in the factory sector eased to a 2.5% growth rate from a downwardly revised 4.0% during 3Q. For all of 2007 factory sector productivity rose 2.9%, the slowest rate of growth since 2001. The weakness in productivity resulted as output growth slowed to -1.9% from 3.9% in 3Q and that outpaced the slowdown in hours worked to -4.3% from -0.1%. The 4.2% rise in factory sector compensation pulled unit labor costs up 1.7% after a 2.9% 3Q decline. For the full year unit labor costs in the factory sector rose 1.6% after two years of negative growth and that rate of increase was the quickest since 2000.
The January 2008 Senior Loan Officer Opinion Survey on Bank Lending Practices from the Federal Reserve Board is available here.
How well do wages follow productivity growth? from the Federal Reserve Bank of St. Louis can be found here.
| Non-farm Business Sector (SAAR) | Q4 '07 | Q3 '07 | Y/Y | 2007 | 2006 | 2005 |
|---|---|---|---|---|---|---|
| Output per Hour | 1.8% | 6.0% | 2.6% | 1.6% | 1.0% | 1.9% |
| Compensation per Hour | 3.9% | 4.0% | 3.7% | 4.8% | 3.9% | 4.0% |
| Unit Labor Costs | 2.1% | -1.9% | 1.0% | 3.1% | 2.9% | 2.0% |
by Robert Brusca February 6, 2008
Not every inflation report or trend in the EMU is bad news.
But the news is still not pleasing to an ECB that is trying to inherit
the mantel of inflation fighting respectability from the Bundesbank.
Inflation in the Euro Area consists of an overall HICP measure but
there is also the country level data that contribute to the HICP.
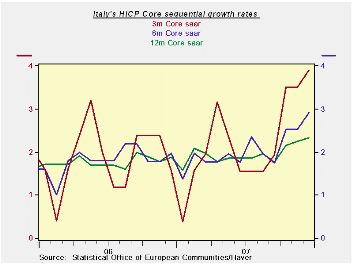
Italy’s new inflation report is shown below. Headline inflation slowed
sharply in January and the three-month growth rate edged slightly lower
from its six-month value. Even so, that rate is unacceptably high.
Across categories inflation slowed producing a diffusion rate of 42%
implying that the deceleration was relatively widespread. But over six
months diffusion shows that it has accelerated and over 12 months it is
about the same as it was a year ago in terms of the breadth of the
acceleration/deceleration (diffusion) even though it is higher in terms
of the headline and the core.
The chart shows that the core rate has been steadily accelerating. But if energy prices abate that trend should be truncated. In short Italy’s data are the exact reason that the ECB remains wary. While the current month hints at a break in the pace the trends are simply not good enough to take the ECB off guard.
| Italy HICP and CPI details | |||||||
|---|---|---|---|---|---|---|---|
| Mo/Mo % | Saar % | Yr/Yr | |||||
| Jan-08 | Dec-07 | Nov-07 | 3-Mo | 6-Mo | 12-Mo | Yr Ago | |
| HICP Total | 0.1% | 0.4% | 0.4% | 3.5% | 3.9% | 3.1% | 1.9% |
| Core | -- | 0.3% | 0.2% | -- | -- | -- | 1.6% |
| CPI | |||||||
| All | 0.4% | 0.4% | 0.4% | 4.9% | 3.8% | 2.9% | 1.8% |
| CPI excl Tobacco | -- | 0.4% | 0.4% | -- | -- | -- | 1.6% |
| Food | 0.5% | 0.5% | 0.5% | 6.0% | 6.9% | 4.5% | 2.6% |
| Alcohol | 0.9% | 0.2% | 0.1% | 4.6% | 4.7% | 3.5% | 4.6% |
| Clothing & Shoes | 0.1% | 0.1% | 0.2% | 1.8% | 1.8% | 1.6% | 1.4% |
| Rent & Utilities | 1.1% | 0.5% | 0.7% | 9.8% | 7.4% | 4.0% | 4.2% |
| Housing & Furniture | 0.8% | 0.2% | 0.2% | 4.7% | 3.6% | 3.6% | 1.6% |
| Health Care | 0.2% | -0.2% | -0.2% | -1.0% | 0.5% | 0.7% | -1.5% |
| Transport | 0.9% | 1.1% | 0.7% | 11.7% | 7.4% | 5.5% | 1.7% |
| Communication | -0.7% | -0.1% | 0.0% | -3.4% | -4.2% | -8.4% | -4.5% |
| Recreation & Culture | -1.1% | 0.6% | 0.1% | -1.6% | -0.2% | 0.6% | 0.9% |
| Education | 0.1% | 0.1% | 0.1% | 1.5% | 2.1% | 2.2% | 2.3% |
| Restaurant & Hotel | -0.1% | 0.2% | 0.1% | 0.8% | 1.4% | 2.4% | 2.4% |
| Other | 0.4% | 0.1% | 0.4% | 3.7% | 3.5% | 3.1% | 2.3% |
| Diffusion | 41.7% | 66.7% | 50.0% | -- | |||
| Type: | Diffusion: Compared to | 6-mo | 12-mo | Yr-Ago | -- | ||
by Robert Brusca February 6, 2008
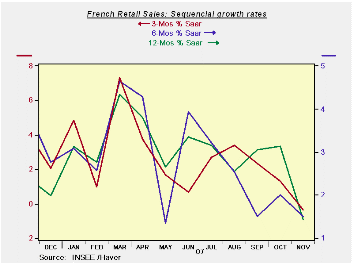
French sequential growth rates are working their way lower for
the volume of total retail sales. Passenger car registrations have,
however, picked up a bit. The spike up in car registrations has to do
with some changing regulations in France and are clustering sales into
the current periods much as they did at the end of 2006 for Germany as
buyers there tried to avoid the coming VAT hike. The overall retail
numbers do not show much of this effect since the impact is for an
auto-specific change related to environmental concerns.
Retail sales volumes in France continue to move ahead at a 2%
pace over three months, a bit less than their 3% yr/yr rate and the
same as the year ago pace of 2%. French consumers, like other Euro Area
consumers are having a hard time getting spending on track. With the
new financial turmoil, higher energy prices, strong euro and slowing
economy, the consumer may not turn that corner to better times.
| French Real Retail Sales | ||||||||
|---|---|---|---|---|---|---|---|---|
| Dec-07 | Nov-07 | Oct-07 | 3-MO | 6-MO | 12-MO | Yr Ago | QTR: SAAR | |
| VOLUME | ||||||||
| Retail Volume | 0.9% | -0.7% | 0.2% | 2.0% | 2.2% | 3.0% | 2.0% | 1.0% |
| Registrations | ||||||||
| Passenger Cars | 10.7% | 0.5% | 0.3% | 54.7% | 35.4% | 19.8% | -4.4% | 26.7% |

Tom Moeller
AuthorMore in Author Profile »Prior to joining Haver Analytics in 2000, Mr. Moeller worked as the Economist at Chancellor Capital Management from 1985 to 1999. There, he developed comprehensive economic forecasts and interpreted economic data for equity and fixed income portfolio managers. Also at Chancellor, Mr. Moeller worked as an equity analyst and was responsible for researching and rating companies in the economically sensitive automobile and housing industries for investment in Chancellor’s equity portfolio. Prior to joining Chancellor, Mr. Moeller was an Economist at Citibank from 1979 to 1984. He also analyzed pricing behavior in the metals industry for the Council on Wage and Price Stability in Washington, D.C. In 1999, Mr. Moeller received the award for most accurate forecast from the Forecasters' Club of New York. From 1990 to 1992 he was President of the New York Association for Business Economists. Mr. Moeller earned an M.B.A. in Finance from Fordham University, where he graduated in 1987. He holds a Bachelor of Arts in Economics from George Washington University.
More Economy in Brief


