 Global| Mar 18 2008
U.S. PPI Total & Total Firm
by:Tom Moeller
|in:Economy in Brief
Summary
Finished producer prices in the U.S. rose 0.3% during February following a 1.0% surge in January. The latest increase fell just short of Consensus expectations for a 0.4% rise but the 6.8% increase versus last February was near this [...]
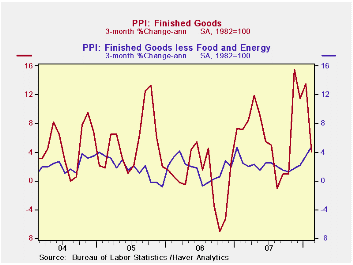
Finished producer prices in the U.S. rose 0.3% during February following a 1.0% surge in January. The latest increase fell just short of Consensus expectations for a 0.4% rise but the 6.8% increase versus last February was near this cycle's high. Moreover it was well up from the 3.9% increase during all of last year.
Less food and energy the 0.5% increase in prices was quite a
bit stronger than expectations for a 0.2% gain. While the y/y increase
held roughly steady at 2.5% the annualized rate of growth during the
last three months surged to 4.7%, about the fastest in ten years.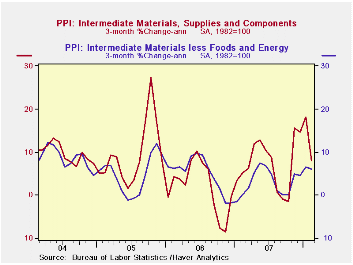
Energy prices rose 0.8% (20.7% y/y) and added to the prior month's 1.5% surge. Gasoline prices rose 2.9% for the second consecutive month (43.2% y/y) though home heating oil prices fell 3.7% (+36.8% y/y). Natural gas prices jumped 5.7% (5.3% y/y).
Why Do Gasoline Prices React to Things That Have Not Happened? from the Federal Reserve Bank of St. Louis is available here.
Finished consumer food prices fell 0.5% (+6.0% y/y) and gave
back just a piece of the 1.7% January surge. During the past three
months food prices have risen at a 10.8% annual rate.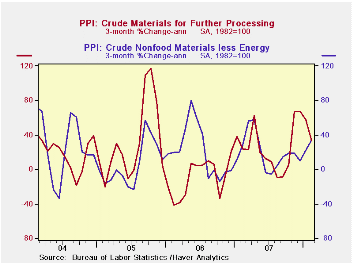
Prices of core finished consumer goods rose 0.5% (2.5% y/y). That gain was well ahead of expectations for a 0.2% increase and it raised the three month change to 4.7% (AR). Passenger car prices rose 0.8% (1.2% y/y). Capital equipment prices rose a firm 0.5% (1.9% y/y) led by a 0.8% rise in prices of light trucks (0.1% y/y).
Intermediate goods prices rose 0.8% following the 1.4% January surge. Excluding food & energy prices were strong again and posted a 0.6% increase. Industrial chemical prices remained quite firm and rose 17.8% from last year.
The crude materials PPI surged again during February. A 3.7% rise followed the 2.5% jump during January. Crude energy materials prices jumped another 5.6% (30.2% y/y). The core crude materials PPI also was quite firm and posted a 3.3% gain. Prices for iron & steel scrap are up 34.5% y/y and copper base scrap prices are 25.1% higher y/y.
| Producer Price Index (%) | February | January | Y/Y | 2007 | 2006 | 2005 |
|---|---|---|---|---|---|---|
| Finished Goods | 0.3 | 1.0 | 6.8 | 3.9 | 3.0 | 4.9 |
| Core | 0.5 | 0.4 | 2.5 | 1.9 | 1.5 | 2.4 |
| Intermediate Goods | 0.8 | 1.4 | 9.1 | 4.1 | 6.4 | 8.0 |
| Core | 0.6 | 0.8 | 4.8 | 2.8 | 6.0 | 5.5 |
| Crude Goods | 3.7 | 2.5 | 24.6 | 12.2 | 1.4 | 14.6 |
| Core | 3.3 | 4.0 | 20.6 | 15.9 | 20.8 | 4.9 |
by Tom Moeller March 18, 2008
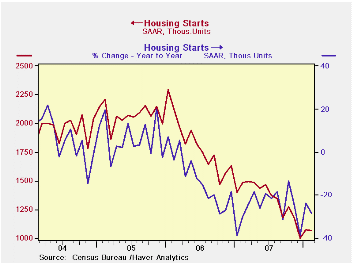
Housing starts during February were firmer than expected and fell just 0.6% to 1.065M units. A m/m decline to 0.96M had been the Consensus expectation. In addition, starts in January were revised higher to 1.065M from 1.012M reported last month.
As occurred last month, however, all of the strength relative to expectations (and most of the revision) was due to the multi-family sector. Starts of condos & coops during February rose 14.4% and January starts were revised higher by nearly one half million units.
Single family starts last month fell 6.7% m/m to .707M after a
3.1% January decline. That decline was revised to show less of a
decline. Single family starts in February were at their lowest level
since January 1991 and since the peak in early 2006, starts
of single family homes were down 61.5%.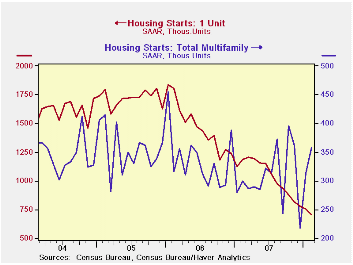
By region, single family starts in the Northeast gave back all of the January increase with a 42.3% decline (-28.9% y/y). In the Midwest single family starts fell to the lowest level since (this is not a typo) early 1985 and were down 25.0% y/y. In the South, single family starts fell 7.0% (-42.5% y/y) and out West single family starts rose by nearly one-third m/m but still were down by nearly one-half from February 2007.
Building permits continued the slide from a 2005 peak with a 7.8% m/m drop. Single-family permits fell 6.2% (-41.9% y/y).
Understanding the Securitization of Subprime Mortgage Credit from the Federal Reserve Bank of New York can be found here.
| Housing Starts (000s, AR) | February | January | Y/Y | 2007 | 2006 | 2005 |
|---|---|---|---|---|---|---|
| Total | 1,065 | 1,071 | -28.4% | 1,344 | 1,812 | 2,073 |
| Single-Family | 707 | 758 | -40.5% | 1,039 | 1,474 | 1,719 |
| Multi-Family | 358 | 313 | 19.7% | 304 | 338 | 354 |
| Building Permits | 978 | 1,061 | -36.5% | 1,371 | 1,842 | 2,159 |
by Tom Moeller March 18, 2008
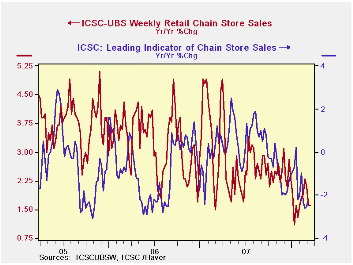
For last week, the International Council of Shopping Centers ICSC-UBS Chain Store survey indicated that chain store sales rose 0.4% and added to the prior week's 0.3% rise. The increases raised the average level of sales so far this month 0.2% from February after that month's 0.4% increase.
During the last ten years there has been a 45% correlation between the y/y change in chain store sales and the change in nonauto retail sales less gasoline.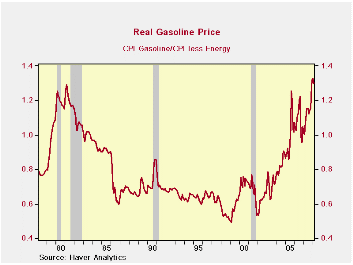
The ICSC-UBS retail chain-store sales index is constructed using the same-store sales (stores open for one year) reported by 78 stores of seven retailers: Dayton Hudson, Federated, Kmart, May, J.C. Penney, Sears and Wal-Mart.
During the latest week the leading indicator of chain store sales from ICSC-UBS remained quit week and was unchanged w/w.The index has trended steadily lower since early January.
Retail gasoline prices were again strong last week and repeated the prior period's six cent rise. The level of $3.28 per gallon, according to the U.S. Department of Energy survey, was a new high.In real terms (calculated as the CPI for gasoline divided by the total CPI less energy) gasoline prices remained in February just above the old high reached early in 1981.
Real gasoline prices likely will reach a new high this month
as the wholesale price of gasoline is up more than ten cents from the
February average.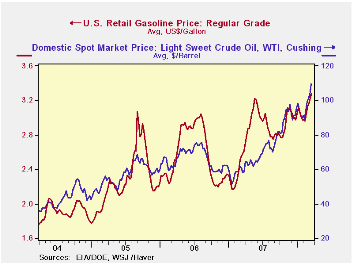
Crude oil prices have been quite strong with the average for WTI crude at $109.43 per bbl., up roughly ten dollars from the February average. Crude prices backed off slightly yesterday.
These energy price series are available in Haver's Daily and Weekly databases.
| ICSC-UBS (SA, 1977=100) | 03/14/08 | 03/08/08 | Y/Y | 2007 | 2006 | 2005 |
|---|---|---|---|---|---|---|
| Total Weekly Chain Store Sales | 490.1 | 488.3 | 1.6% | 2.8% | 3.3% | 3.6% |
| Weekly Prices | 03/17/08 | 03/10/08 | Y/Y | 2007 | 2006 | 2005 |
|---|---|---|---|---|---|---|
| Retail Gasoline ($ per Gallon) | 3.28 | 3.23 | 27.4% | 2.80 | 2.57 | 2.27 |
| Light Sweet Crude Oil, WTI ($ per bbl.) | 109.43 | 103.43 | 88.9% | 94.00 | 61.11 | 58.16 |
by Tom Moeller March 18, 2008
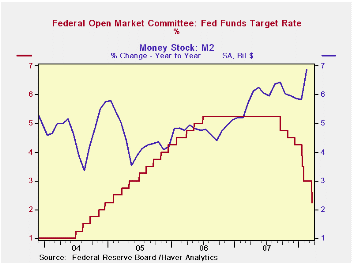
Today, the Federal Open Market Committee lowered the Federal funds rate by 75 basis points to 2.25% in a move that was somewhat more aggressive than generally expected. The funds rate was last this low early in 2005 and it was the largest cut since this past January.
The discount rate was lowered another 75 basis points to 2.5% after this weekend's cut from 3.5%.
The Fed indicated that "the outlook for economic activity has weakened further. Growth in consumer spending has slowed and labor markets have softened. Financial markets remain under considerable stress, and the tightening of credit conditions and the deepening of the housing contraction are likely to weigh on economic growth over the next few quarters."
The Fed further indicated that "Today’s policy action, combined with those taken earlier, including measures to foster market liquidity, should help to promote moderate growth over time and to mitigate the risks to economic activity. However, downside risks to growth remain."
Voting against taking the action was Richard W. Fisher, President of the Federal Reserve Bank of Dallas and Charles I. Plosser, President of the Philadelphia Fed, who preferred less aggressive action at this meeting.
For the complete text of the Fed's latest press release please follow this link.
Market Bailouts and the "Fed Put" from the Federal Reserve Bank of St. Louis can be found here.
Booms and Busts: The Case of Subprime Mortgages from the Federal Reserve Bank of Kansas City is available here.
Italy’s Trade Deficit Widens: Complex Picture Emergesby Robert Brusca March 18, 2008
Italy’s export and import rise in January and continue to show
good momentum despite forecasts of slowing in the Euro Area and a
continually rising euro. While MFG readings have showed slowing the
export picture remains surprisingly strong.
After declines in the year ago period Italy’s exports have
come back to life with strong growth across the export categories.
Capital goods exports remain especially strong. On the import side
growth has also been quite strong. Year over year both export and
imports up by just about 10%.
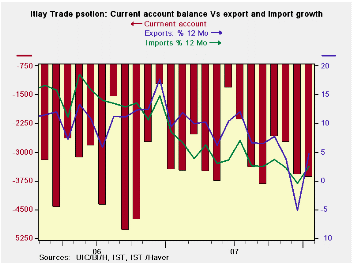
However the chart provides a different perspective. Despite
all the solid growth rates the time series of Yr/Yr growth rates shows
that apart from a sharp drop and recovery over the past year Italy’s
export and import Year-over-year growth rates are still locked in a
broad declining trend.
| Italy's Trade Trends | |||||||
|---|---|---|---|---|---|---|---|
| m/mo % monthly rate | Period Specified saar | ||||||
| Jan-08 | Dec-07 | Nov-07 | 3-Mo | 6-Mo | 12-Mo | Yr-Ago | |
| Current Account Balance | €€ (3,670) | €€ (3,589) | €€ (2,763) | €€ (3,341) | €€ (3,311) | €€ (3,060) | €€ (3,299) |
| Goods Balance | €€ 288 | €€ (1,255) | €€ 455 | €€ (171) | €€ 174 | €€ 171 | €€ (762) |
| Exports | 16.2% | -9.1% | -3.3% | 8.9% | 8.7% | 9.9% | 13.3% |
| Imports | 10.3% | -3.6% | -2.7% | 14.4% | 3.3% | 9.9% | 9.0% |
| Services Balance | €€ 247 | €€ (40) | €€ (415) | €€ (69) | €€ (392) | €€ (476) | €€ (180) |
| Exports | 3.6% | 8.0% | -2.6% | 40.6% | 27.5% | 10.0% | 2.4% |
| Imports | -0.3% | 2.4% | -2.9% | -3.3% | 5.4% | -1.0% | 18.3% |
| Not Seasonally Adjusted | All Yr/Yr | ||||||
| Exports | Jan-08 | Jan-07 | Jan-06 | Jan-05 | |||
| Food & Beverages | 18.3% | -- | -2.0% | -- | 10.9% | -- | 7.2% |
| Capital Goods | 14.2% | -- | 5.3% | -- | 14.4% | -- | 8.8% |
| Transport | 12.1% | -- | -3.1% | -- | 24.0% | -- | 8.5% |
| Consumer Goods | 12.3% | -- | -2.7% | -- | 10.8% | -- | 8.6% |
| Other Goods | 7.2% | -- | 18.1% | -- | 9.2% | -- | 22.6% |
| Imports | Jan-08 | Jan-07 | Jan-06 | Jan-05 | |||
| Food & Beverages | 6.4% | -- | -5.2% | -- | 14.7% | -- | 4.9% |
| Capital Goods | 10.6% | -- | 5.7% | -- | 7.2% | -- | 4.2% |
| Transport | 11.2% | -- | 11.2% | -- | 4.4% | -- | 3.8% |
| Consumer Goods | 8.1% | -- | -1.2% | -- | 18.8% | -- | 2.8% |
| Other Goods | 17.8% | -- | 3.0% | -- | 37.2% | -- | 17.2% |
| Balances in Mil of Euros | |||||||
by Louise Curley March 18, 2008
With turmoil in world financial markets and slowing economies, monetary authorities in some of the countries that have been targeting inflation may find the "target" too restrictive.
The release of inflation data in the United Kingdom and Canada today illustrates two different cases. In the United Kingdom where inflation is increasing and economic conditions deteriorating, inflation targeting may be relaxed. In Canada where inflation is falling, weakening demand can be addressed by easier monetary policies without fear of setting off an inflationary spiral.
In the UK, where the base interest rate is 5.25%, a reduction
in the rate would ordinarily be likely in view of the slowing economy.
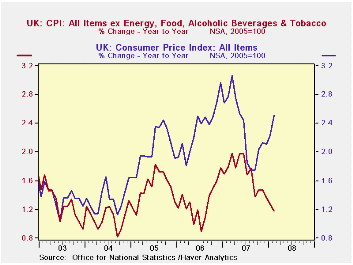
However, inflation has been creeping up since a low of 1.75% was
reached last August. It was 2.51% in February, the highest since June
of last year and well above the Bank of England's target rate of 2%. On
the other hand, Core inflation, defined as total excluding energy,
food, alcoholic beverages and tobacco, has been declining over the same
period and is now 1.17%. 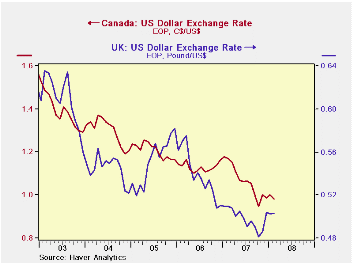 Overall
inflation and core inflation in the UK are shown in the first chart.
The better performance of the core relative to total inflation may
influence the Monetary Policy Committee against raising interest rates
and may even pave the way for a cut. The next meeting of the Monetary
Policy Commission of the Bank of England will be on April 10th.
Overall
inflation and core inflation in the UK are shown in the first chart.
The better performance of the core relative to total inflation may
influence the Monetary Policy Committee against raising interest rates
and may even pave the way for a cut. The next meeting of the Monetary
Policy Commission of the Bank of England will be on April 10th.
The Bank of Canada reduced its base rate by 50 basis points to 3.5% on March 4, 2008. At that time the Bank suggested that further monetary stimulus might be required. It is unlikely that monetary policy in Canada in the coming months will be restrained by inflation considerations. Inflation has been declining since November and was 1.8% in February. below the Bank of Canada's target rate of 2%. Although core inflation, defined as total inflation less 8 volatile items and indirect taxes, increased from 1.38% in January to 1.47% in February it was the first increase in core inflation since June, 2006 and the level is still relatively subdued. Overall inflation and core inflation in Canada are shown in the second chart. The next interest rate announcement by the Bank of Canada will be on April 22, 2008.
| CONSUMER PRICE INDEXES AND INFLATION | Feb 08 | Jan 08 | Feb 07 | M/M %Chg | Y/Y %Chg | 2006 | 2005 | 2004 |
|---|---|---|---|---|---|---|---|---|
| UNITED KINGDOM | ||||||||
| Total CPI (2005 =100) | 106.3 | 105.5 | 103.7 | 0.76 | 2.51 | 104.7 | 102.33 | 100.0 |
| Core CPI (2005 =100) | 103.4 | 103.1 | 102.2 | 0.29 | 1.17 | 103.0 | 101.3 | 100.0 |
| CANADA | ||||||||
| Total CPI (2005=100)* | 104.9 | 104.5 | 103.0 | 0.36 | 1.81 | 104.2 | 102.0 | 100.0 |
| Core CPI (2005=100)* | 105.0 | 104.4 | 103.4 | 0.54 | 1.47 | 104.1 | 101.9 | 100.0 |
| * Rebased from (2002=100) | ||||||||

Tom Moeller
AuthorMore in Author Profile »Prior to joining Haver Analytics in 2000, Mr. Moeller worked as the Economist at Chancellor Capital Management from 1985 to 1999. There, he developed comprehensive economic forecasts and interpreted economic data for equity and fixed income portfolio managers. Also at Chancellor, Mr. Moeller worked as an equity analyst and was responsible for researching and rating companies in the economically sensitive automobile and housing industries for investment in Chancellor’s equity portfolio. Prior to joining Chancellor, Mr. Moeller was an Economist at Citibank from 1979 to 1984. He also analyzed pricing behavior in the metals industry for the Council on Wage and Price Stability in Washington, D.C. In 1999, Mr. Moeller received the award for most accurate forecast from the Forecasters' Club of New York. From 1990 to 1992 he was President of the New York Association for Business Economists. Mr. Moeller earned an M.B.A. in Finance from Fordham University, where he graduated in 1987. He holds a Bachelor of Arts in Economics from George Washington University.
More Economy in Brief


