 Global| Jul 15 2008
U.S. PPI Surged Again
by:Tom Moeller
|in:Economy in Brief
Summary
U.S. finished producer prices jumped another 1.8% during June after the 1.4% surge during May. The increase surpassed Consensus expectations for a 1.3% rise. Finished energy prices led the increase with a 6.0% pop as gasoline prices [...]
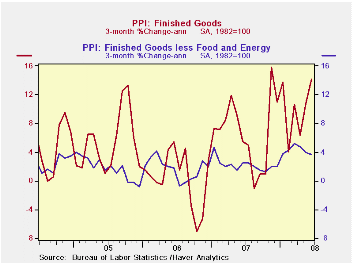
U.S. finished producer prices jumped another 1.8% during June after the 1.4% surge during May. The increase surpassed Consensus expectations for a 1.3% rise.
Finished energy prices led the increase with a 6.0% pop as
gasoline prices surged another 9.0% (39.7% y/y). Natural gas prices
continued strong and surged 6.6% (17.6% y/y). Residential electric
power costs rose 0.8% (4.7% y/y).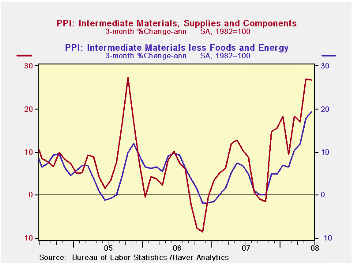
Finished consumer food prices surged by 1.5% (8.4% y/y), double the May increase. The strength continued to be led by fresh vegetables (34.0% y/y) and pasta products (37.3% y/y).
Less food & energy, the gain in finished goods prices
rose the same 0.2% as they did during May. The latest figure fell
slightly short of expectations for a 0.3% rise. Prices of core finished
consumer goods rose the same 0.3% (3.5% y/y) as they did in May and the
three-month rate of rise remained down somewhat at 4.2%. Durable
consumer goods prices rose 0.3% (1.6% y/y) after the 0.4% May fall.
Capital equipment prices gained 0.3% (2.4% y/y).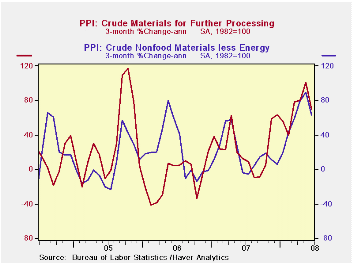
Intermediate goods prices surged yet again, last month by 2.1%. Excluding food & energy these prices jumped another 1.3%.
The crude materials PPI surged 3.7% due to a 5.4% (72.1% y/y) jump in energy prices. Crude food prices also doubled their May strength and surged 3.5% (20.8% y/y). Less food & energy crude prices fell 0.2%.
Back to the Future with Keynes from the Federal Reserve Bank of Minneapolis can be found here.
| Producer Price Index (%) | June | May | Y/Y | 2007 | 2006 | 2005 |
|---|---|---|---|---|---|---|
| Finished Goods | 1.8 | 1.4 | 9.1 | 3.9 | 3.0 | 4.9 |
| Core | 0.2 | 0.2 | 3.1 | 1.9 | 1.5 | 2.4 |
| Intermediate Goods | 2.1 | 2.9 | 12.5 | 4.1 | 6.4 | 8.0 |
| Core | 1.3 | 2.0 | 8.4 | 2.8 | 6.0 | 5.5 |
| Crude Goods | 3.7 | 6.7 | 45.7 | 12.1 | 1.4 | 14.6 |
| Core | -0.2 | 5.0 | 33.2 | 15.7 | 20.8 | 4.9 |
by Tom Moeller July 15, 2008
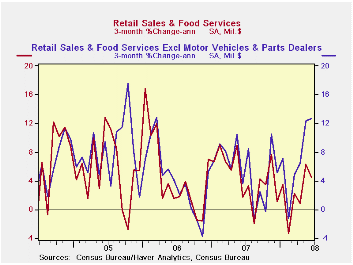
U.S. retail sales during June inched up just 0.1% after having risen a downwardly revised 0.8% in May. On a three-month basis overall retail sales rose at a 4.5% annual rate. The latest rise fell short of Consensus expectations for a 0.4% increase.
Sales of motor vehicles & parts fell another 3.6% (-10.5% y/y) and they are down at a 27.0% annual rate during the last three months. The decline accompanied a 4.6% (-13.1% y/y) drop in unit motor vehicle sales last month.
Retail sales excluding autos rose 0.8% and
the strong 1.2% rise in May was unrevised, boosted recently by receipts
of the government's tax rebate checks. The latest increase was double
Consensus expectations for a 0.4% rise, but a 4.6% (24.5% y/y) increase
in sales at gasoline service stations accounted for much of the
strength.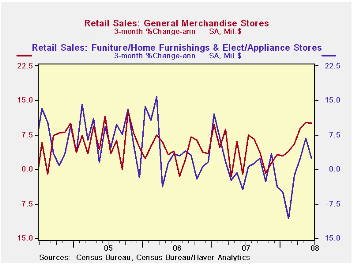
Less gasoline & autos retail sales inched up just 0.2% (3.6% y/y) which was the weakest increase since February. Nevertheless, on a three-month basis these sales still were strong and surged at an 8.8% annual rate during the last three months.
Folks attempted to avoid the higher gas prices by purchasing online. June sales of nonstore retailers (internet & catalogue) rose 0.8% (8.1% y/y) following downwardly revised, but still strong, gains which exceeded 1.0% during the prior three months.
Sales at general merchandise stores rose 0.4% (5.6% y/y) following the 1.3% pop in May. Sales offurniture, home furnishings & appliance, however, reversed all of the upwardly revised May surge of 1.0% (-0.1% y/y). Sales of furniture & home furnishings declined 1.4% (-5.4% y/y). Apparel store sales rose 0.6% (2.9% y/y), about the same as they did during the prior three months.
Building materials & garden equipment sales fell 0.9% (+1.5%% y/y) after gains which exceeded 2.0% during the prior two months.
Released yesterday, the Federal Reserve Board's final rule for home mortgage loans to better protect consumers and facilitate responsible lending can be found here.
Doom & Gloom in the Housing Markets: The Sequel from the Federal Reserve Bank of St. Louis is available here.
| June | May | Y/Y | 2007 | 2006 | 2005 | |
|---|---|---|---|---|---|---|
| Retail Sales & Food Services | 0.1% | 0.8% | 3.0% | 4.0% | 5.8% | 6.4% |
| Excluding Autos | 0.8% | 1.2% | 6.2% | 4.5% | 6.8% | 7.5% |
| Less Gasoline | 0.2% | 0.8% | 3.6% | 4.1% | 6.2% | 6.4% |
by Tom Moeller July 15, 2008
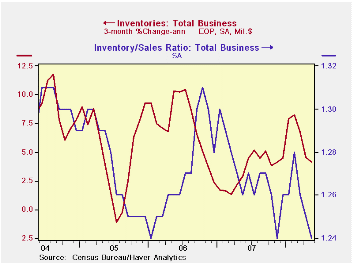
Total business inventories rose 0.3% during May after a 0.5% April gain. The latest increase fell short of expectations and it reduced three-month growth in inventories to 4.1% (AR) which was its slowest since November.
Retail inventories fell 0.4% and reversed all of the March increase. The three-month growth rate fell further to a negative 2.2% which reflects the draw-down of automobile inventories. Inventories of motor vehicle & parts fell at a 7.6% annual rate during the last three months due to further production cutbacks. Outside of autos, retail inventories rose at a slight 0.4 rate over the last three months versus a 2.7% rise last year and a 4.9% increase during 2006.
The industry detail in the retail sector indicated that furniture inventories fell at a 1.4% rate during the last three months. Clothing & accessory store inventories continued to fall sharply at a 4.1% rate while general merchandise stores' inventories dropped at a 2.0% rate.
Wholesale inventories rose at a 9.7% rate during the last three months, boosted by the rise in oil prices but less petroleum inventories also rose at a firm 9.8% rate which was twice the rate of increase during all of last year.
Factory inventories rose 0.5% after the sight decline during April. Three-month growth fell to 5.9% (AR) which was half the growth earlier this year. Despite the rise in oil prices, petroleum inventories still rose at a modest 2.1% rate over the last three months. Elsewhere, factory inventory accumulation has been fairly steady in 2008 at a 6.2% rate.
Total business sales surged again, in May by 0.8%. Three-month growth jumped to a 15.1% annual rate.
The inventory-to-sales ratio for all business fell to 1.24 in May which was the low for this cycle.
Fed Chairman ChairmanBen S. Bernanke's Semiannual Monetary Policy Report to the Congress can be found here.
| Business Inventories | May | April | Y/Y | 2007 | 2006 | 2005 |
|---|---|---|---|---|---|---|
| Total | 0.3% | 0.5% | 5.3% | 3.8% | 5.9% | 6.0% |
| Retail | -0.4% | 0.4% | 1.7% | 2.6% | 3.5% | 2.3% |
| Retail excl. Auto | -0.2% | 0.7% | 1.6% | 2.7% | 4.9% | 3.9% |
| Wholesale | 0.8% | 1.4% | 8.7% | 5.5% | 8.3% | 7.3% |
| Manufacturing | 0.5% | -0.0% | 6.1% | 3.7% | 6.4% | 8.9% |
by Tom Moeller July 15, 2008
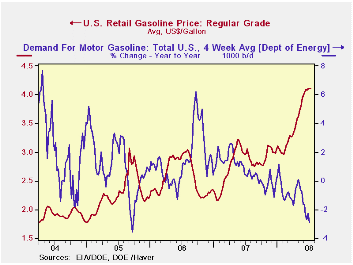
The retail price for a gallon of regular gasoline held at $4.11 per gallon last week, according to the U.S. Department of Energy survey. For all grades of gasoline the average price also held steady w/w at an average $4.16 per gallon.
Yesterday, the spot market price for a gallon of regular gasoline was $3.31 per gallon, about where it has been since early June.
Weekly gasoline prices can be found in Haver's WEEKLY
database, daily prices are in the DAILY
database.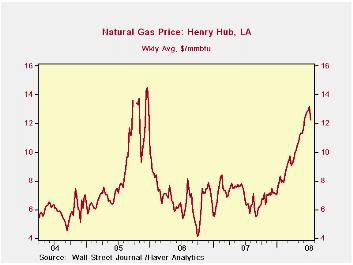
According to the U.S. Department of Energy the demand for gasoline during the latest four weeks fell 2.9% from a year earlier due to the increase in gasoline prices, along with the slowdown in economic growth. That was the weakest reading for gasoline demand in three years.
The DOE figures are available in Haver's OILWKLY database.
Last week the price for a barrel of West Texas Intermediate crude oil slipped to $140.16 per barrel, down slightly from $142.46 during all of last week.
Price for natural gas also have been quite strong but last week slipped to $12.240 per mmbtu (92..1% y/y), near the record high reached in late-2005.
Consumer Sentiment and Consumer Spending from the Federal Reserve Bank of San Francisco can be found here.
| Weekly Prices | 07/14/08 | 07/07/08 | Y/Y | 2007 | 2006 | 2005 |
|---|---|---|---|---|---|---|
| Retail Regular Gasoline ($ per Gallon) | 4.11 | 4.11 | 34.9% | 2.80 | 2.57 | 2.27 |
| Light Sweet Crude Oil, WTI ($ per bbl.) | 140.16 | 142.46 | 98.4% | 72.25 | 66.12 | 56.60 |
by Robert Brusca July 15, 2008
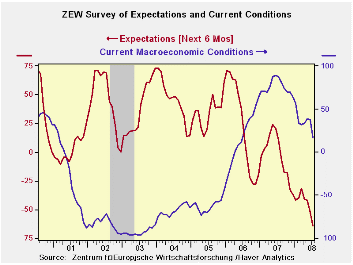
The Zew index took a real turn for the worse. Expectations are on an all time low. German denial is coming rapidly to a close. Belief in the de-linked business cycle is going the way of belief in the tooth fairy. It’s something you just have to grow out of even if you once believed in it. The current conditions index is still relative high valued standing in the 61st percentile of its range. But it fell very sharply in July to an index reading of 17.1 from 37.6 the month before. German optimists are becoming a rarer breed.
German expectations for various stock sectors is at its lowest reading since the full series began in April of 1999. Sector expectations rank at 122 out of 122 months of history. Profit expectations are abysmal.
But the German story is still more complicated. Ordinarily a drop like this would bring expectations that the ECB would not continue hiking rates or might even foster expectations of cutting them and undermine the euro exchange rate. But this time the euro has popped up to anew high Vs the dollar showing that US troubles have for the moment trumped concerns that Germans might have about their own economy and the EMU economy at large. I think this will pass. One thing that is clear is that energy and financial problems are dragging down the growth rates in the European economies but that at the current level, the euro is just too high. I cannot see the euro moving significantly higher from here.
| ZEW Economic Index For Germany | |||||||
|---|---|---|---|---|---|---|---|
| Level of Zew Index | Averages | ||||||
| Jul-08 | Jun-08 | May-08 | Yr Ago | 3-Mo | 6-Mo | 12-Mo | |
| Current | 17 | 37.6 | 38.6 | 88.2 | 31.1 | 32.0 | 50.6 |
| Expectations | -63.9 | -52.4 | -41.4 | 10.4 | -52.6 | -45.0 | -35.4 |
| Percentiles | |||||||
| Current | 61.7 | 72.7 | 73.2 | 99.7 | -- | -- | -- |
| Expectations | 0.0 | 7.5 | 14.7 | 48.4 | -- | -- | -- |
| Percentiles are readings in this period as percentile of the full range of values back to 1/92 | |||||||
by Tom Moeller July 15, 2008
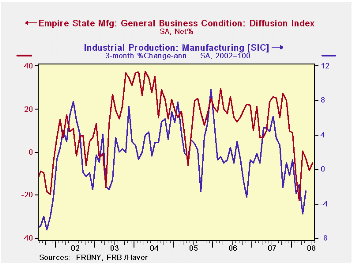
The Federal Reserve Bank of New York reported that its July index of manufacturing activity in the Empire State remained negative at -4.92 after the unrevised -8.68 during June. It was the fifth negative reading this year. A more negative reading of -8.0 for July had been the Consensus expectation.
The figure is a diffusion index. Since the series' inception in 2001 there has been a 55% correlation between the index level and the three-month change in U.S. factory sector industrial production.
Negative readings for inventories and unfilled orders weighed heavily on the July index. The new orders and shipments indexes, however, improved to their first positive readings since April.
The employment index turned to its most negative reading since
2003. In the (perhaps too) short seven year history of the NY
employment index, there has been an 86% correlation between it and the
three-month growth in overall factory sector employment.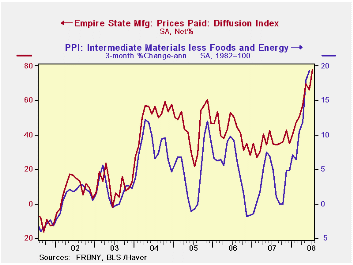
Like the Philadelphia Fed Index of General Business Conditions, the Empire State Business Conditions Index reflects answers to an independent survey question; it is not a weighted combination of the components.
Pricing pressure rose to the highest level in the series' history. The latest index level was 77.89. Since the series' inception in 2001 there has been an 81% correlation between the index of prices paid and the three-month change in the core intermediate materials PPI.
The Empire State index of expected business conditions in six months fell to its lowest level since the recession year of 1981.
The Empire State Manufacturing Survey is a monthly survey of manufacturers in New York State conducted by the Federal Reserve Bank of New York. Participants from across the state in a variety of industries respond to a questionnaire and report the change in a variety of indicators from the previous month. Respondents also state the likely direction of these same indicators six months ahead.
For more on the Empire State Manufacturing Survey, including methodologies and the latest report, click here.
| Empire State Manufacturing Survey | July | June | July '07 | 2007 | 2006 | 2005 |
|---|---|---|---|---|---|---|
| General Business Conditions (diffusion index, %) | -4.92 | -8.68 | 25.73 | 17.23 | 20.24 | 15.53 |
| Prices Paid | 77.89 | 66.28 | 34.57 | 35.64 | 41.88 | 44.74 |

Tom Moeller
AuthorMore in Author Profile »Prior to joining Haver Analytics in 2000, Mr. Moeller worked as the Economist at Chancellor Capital Management from 1985 to 1999. There, he developed comprehensive economic forecasts and interpreted economic data for equity and fixed income portfolio managers. Also at Chancellor, Mr. Moeller worked as an equity analyst and was responsible for researching and rating companies in the economically sensitive automobile and housing industries for investment in Chancellor’s equity portfolio. Prior to joining Chancellor, Mr. Moeller was an Economist at Citibank from 1979 to 1984. He also analyzed pricing behavior in the metals industry for the Council on Wage and Price Stability in Washington, D.C. In 1999, Mr. Moeller received the award for most accurate forecast from the Forecasters' Club of New York. From 1990 to 1992 he was President of the New York Association for Business Economists. Mr. Moeller earned an M.B.A. in Finance from Fordham University, where he graduated in 1987. He holds a Bachelor of Arts in Economics from George Washington University.
More Economy in Brief


