 Global| Feb 18 2010
U.S. PPI Jumps Again With EnergyPrice Strength
by:Tom Moeller
|in:Economy in Brief
Summary
Producer prices continued strong last month led by another jump in fuel costs. In addition, food price inflation has picked up considerably. Together, this strength lifted the finished goods PPI by 1.4% last month and increased the [...]
 Producer
prices continued strong
last month led by another jump in fuel costs. In addition, food price
inflation has picked up considerably. Together, this strength lifted
the finished goods PPI by 1.4% last month and increased the 12-month
change to 5.0%; the strongest since late-2008. Finally, the January
increase exceeded Consensus expectations for a 0.8% rise.
Producer
prices continued strong
last month led by another jump in fuel costs. In addition, food price
inflation has picked up considerably. Together, this strength lifted
the finished goods PPI by 1.4% last month and increased the 12-month
change to 5.0%; the strongest since late-2008. Finally, the January
increase exceeded Consensus expectations for a 0.8% rise.
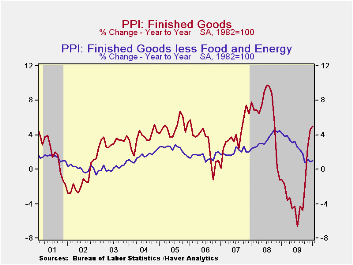
Higher energy costs led the strength in the PPI last month. The 5.1% m/m gain raised the y/y increase to 21.5%, its strongest since September 2008. Gasoline prices increased 10.4% (69.5% y/y) and fuel oil costs rose 11.0% (28.4% y/y). But elsewhere, the gain in energy prices was more moderate. Natural gas prices increased a lesser 2.4% and were down 12.5% from 12 months ago. Food prices were another source of price strength last month. They posted a 0.4% gain which raised the y/y change to 1.5% versus the low of -4.0% last summer. Fresh fruit & vegetable prices ballooned 43.8% y/y while pork prices jumped 11.8%. Also to the upside were dairy product prices by 5.1% and coffee prices by 2.3% y/y versus a 0.1% uptick last year..
Producer prices excluding food & energy rose 0.3%. That was enough to stabilize the y/y change at 1.0% but it still was down from a 3.4% 2008 increase. The m/m increase in the core PPI also exceeded expectations for a modest 0.1% gain. The PPI for finished consumer goods less food & energy rose 0.4% (1.6% y/y) and was up from a 0.1% December gain. Finished durables prices increased 0.3% (0.7% y/y) while core finished consumer nondurable goods prices rose 0.4% (2.4% y/y). Capital equipment prices increased 0.3% which left prices up 0.1% y/y.
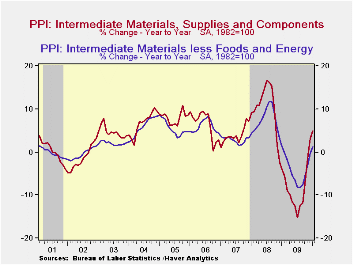
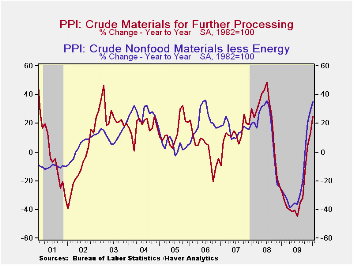
Prices for intermediate goods jumped 1.7% reflecting the strength in energy prices. The increase in core prices was, however, stable at 0.5%. Food prices fell 0.3% but the y/y gain at 1.7% was up from 8.2% price deflation during all of last year. Copper prices (55.3% y/y) and nonferrous wire & cable prices (25.1% y/y) have been notably strong. The crude materials PPI jumped again with the strength in energy prices. The 9.6% m/m increase was the strongest since 2006 and raised prices by one-quarter versus last January. Core prices also jumped. The 6.6% gain lifted prices by more than one-third y/y as economic growth strengthened following the recession.
The producer price data is available in Haver's USECON database. More detailed data is in the PPI and in the PPIR databases.
The minutes to the latest meeting of the Federal Open Market Committee can be found here.
| Producer Price Index(%) | January | December | November | Y/Y | 2009 | 2008 | 2007 |
|---|---|---|---|---|---|---|---|
| Finished Goods | 1.4 | 0.4 | 1.5 | 5.0 | -2.5 | 6.4 | 3.9 |
| Less Food & Energy | 0.3 | 0.0 | 0.5 | 1.0 | 2.6 | 3.4 | 2.0 |
| Intermediate Goods | 1.7 | 0.6 | 1.2 | 4.9 | -8.4 | 10.3 | 4.0 |
| Core Less Food & Energy | 0.5 | 0.5 | 0.3 | 1.1 | -4.2 | 7.4 | 2.8 |
| Crude Goods | 9.6 | 0.8 | 5.1 | 25.1 | -30.4 | 21.4 | 11.9 |
| Core Less Food & Energy | 6.6 | 4.5 | -1.0 | 35.1 | -23.5 | 14.8 | 15.6 |
by Robert Brusca February 18, 2010
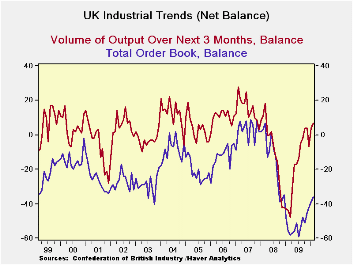
Industrial orders in the UK rose to a reading of -36 in February from -39 marking their best result Since December 2008. The plus-seven reading for expected output volume is the best reading since March of 2008.
Orders reside in the 20th percentile of their range a still-low standing. But export orders stand above the mid point of their range at a percentile of 51.6%. Similarly expected output volume is in the 52nd percentile of its range and average prices expected are in the top 35% of their range. The ranges are from early 1989 to date.
Two observations from these results lead us to the conclusion first, that conditions are still severely impacted. Second, expectations are in place that foresee or expect that the economy is headed for normalcy. Having the three-month outlook variables above their range mid-point is a sign that things are expected to get back to normal in ‘three-months or so.’ Yet the still very weak readings for overall and export orders remind us that current conditions still are under a lot of stress.
The UK industrial sector is making progress. Elsewhere the housing sector is recovering and the budget deficit is ballooning. The UK is making progress but still has some great challenges. For now the news is that the progress continues.
| UK Industrial Volume Data CBI Survey | ||||||||||
|---|---|---|---|---|---|---|---|---|---|---|
| Reported: | Feb 10 |
Jan 10 |
Dec 09 |
Nov 09 |
Oct 09 |
12MO Avg | Pcntle | Max | Min | Range |
| Total Orders | -36 | -39 | -42 | -45 | -51 | -52 | 34% | 9 | -59 | 68 |
| Export Orders | -23 | -33 | -41 | -37 | -46 | -45 | 53% | 3 | -52 | 55 |
| Stocks:FinGds | 12 | 13 | 15 | 20 | 10 | 21 | 42% | 31 | -2 | 33 |
| Looking ahead | ||||||||||
| Output Volume:Nxt 3M | 7 | 4 | -7 | 4 | 4 | -16 | 72% | 28 | -48 | 76 |
| Avg Prices 4Nxt 3m | 8 | -6 | -7 | -5 | -4 | -10 | 52% | 34 | -20 | 54 |
by Tom Moeller February 18, 2010
 The
uptrend
in the Conference Board's Index of Leading Economic Indicators
continued last month though it lost a little steam. The rise of 0.3%
followed stronger monthly gains dating back to April and the six-month
rate of increase at 9.8% (centered) was its weakest since May. The
leading index is based on actual reports for eight economic data
series. The Conference Board initially estimates two series, consumer
and capital goods orders.
The
uptrend
in the Conference Board's Index of Leading Economic Indicators
continued last month though it lost a little steam. The rise of 0.3%
followed stronger monthly gains dating back to April and the six-month
rate of increase at 9.8% (centered) was its weakest since May. The
leading index is based on actual reports for eight economic data
series. The Conference Board initially estimates two series, consumer
and capital goods orders.
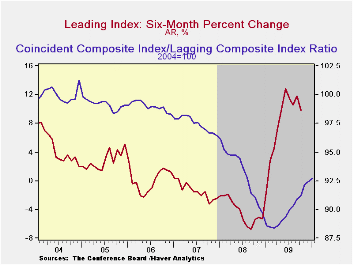
The breadth of increase amongst the component series slipped last month to its lowest since last March. Barely half of the ten components rose during January versus all of them during December. During the most recent six months, however, a stable 80% of the series rose. Prominent in last month's increase was a steeper interest rate yield curve, vendor performance and weekly hours.
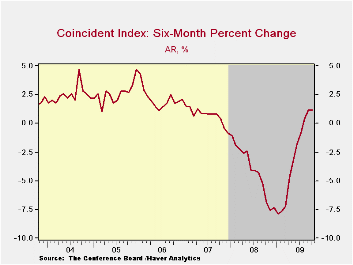
Continuing to suggest economic improvement was the coincident indicator series which rose 0.2%. The gain lifted the six-month change to 1.2%, up from -7.9% at its worst in January of last year. Increases in industrial production, real personal income and business sales have been modest but compare to sharp declines late in 2008. Declines in payroll employment also have eased considerably.
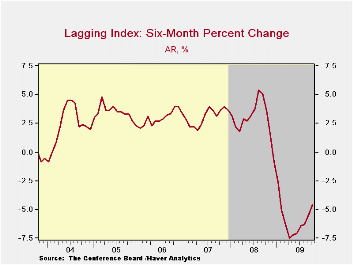
In a continued sign that excesses in the U.S. economy are still falling, the lagging index continues to drop as it has for a year. Leading the decline have been shortened duration of unemployment, lower commercial & industrial loans outstanding and retrenchment in consumer credit. The ratio of coincident-to-lagging indicators (another leading indicator) also continued higher for the tenth straight month to the highest level since September of 2008.
The Conference Board figures are available in Haver's BCI database. Visit the Conference Board's site for coverage of leading indicator series from around the world. The latest U.S. Leading Indicators release can be found here here.
| Business Cycle Indicators (%) | January | December | November | Oct. 6-Month % (AR) | 2009 | 2008 | 2007 |
|---|---|---|---|---|---|---|---|
| Leading | 0.3 | 1.2 | 1.1 | 9.8 | 0.4 | -2.8 | -0.4 |
| Coincident | 0.2 | 0.0 | 0.3 | 1.2 | -5.1 | -1.2 | 1.4 |
| Lagging | -0.1 | -0.3 | -0.7 | -4.6 | -1.6 | 3.2 | 3.0 |
by Tom Moeller February 18, 2010
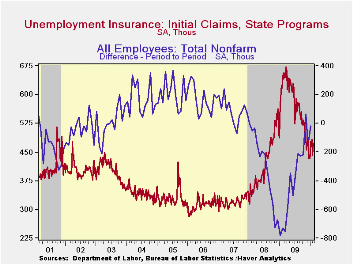 Today's
Labor Department report that initial claims for jobless insurance moved
higher last week after falling during the prior period underscores a
sideways pattern in place since December. Jobless insurance rose 31,000
to 473,000 following a 41,000 decline that was less than reported
initially for the prior week. Down from the recession peak of 674,000
hit last March, claims remained near the lowest level since September
2008. The weekly rise in claims contrasted with Consensus expectations
for a decline to 430,000. The four-week moving average of initial
claims fell slightly to 467,500 and remained just above the cycle low.
Today's
Labor Department report that initial claims for jobless insurance moved
higher last week after falling during the prior period underscores a
sideways pattern in place since December. Jobless insurance rose 31,000
to 473,000 following a 41,000 decline that was less than reported
initially for the prior week. Down from the recession peak of 674,000
hit last March, claims remained near the lowest level since September
2008. The weekly rise in claims contrasted with Consensus expectations
for a decline to 430,000. The four-week moving average of initial
claims fell slightly to 467,500 and remained just above the cycle low.
The latest initial claims figure covers the survey week for February nonfarm payrolls. There were 3,000 (1.3%) fewer claims in February than during the January period. During the last ten years there has been an inverse 84% correlation between the change in payrolls and the level of initial claims.
Continuing claims for unemployment insurance during the latest week were stable at the cycle low which left them down by one-third since late-June. Continuing claims are at the lowest level since early-January of last year. The overall decline is a function of the improved job market but also reflects the exhaustion of 26 weeks of unemployment benefits. Continuing claims provide an indication of workers' ability to find employment. The four-week average of continuing claims fell to a cycle low of 4,585,750. This series dates back to 1966.
Extended benefits for unemployment insurance fell to a new cycle low of 205,744. They were down by two-thirds from a peak of 597,688 reached in November.
The insured rate of unemployment remained stable for the fourth week at a low of 3.5%. The rate reached a high of 5.2% during late-June. During the last ten years, there has been a 93% correlation between the level of the insured unemployment rate and the overall rate of unemployment published by the Bureau of Labor Statistics.
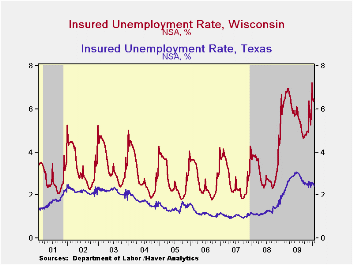
The highest insured unemployment rates in the week ending January 30 were in Alaska (7.3%), Wisconsin (6.4), Pennsylvania (6.4), Montana (6.3), Michigan (5.7), Washington (5.5), North Carolina (5.3) and Connecticut (5.2). The lowest insured unemployment rates were in Virginia (2.3), Texas (2.4), Florida (3.4), Maryland (3.7), Wyoming (3.7), Mississippi (3.7), Ohio (3.9), Indiana (4.0), New York (4.1) and Maine (4.5)
These data are not seasonally adjusted but the overall insured unemployment rate is.
The unemployment insurance claims data is available in Haver's WEEKLY database and the state data is in the REGIONW database.
The Economy and Why the Federal Reserve Needs to Supervise Banks from the Federal Reserve Bank of Minneapolis is available here.
| Unemployment Insurance (000s) | 2/13/10 | 2/6/10 | 1/30/10 | Y/Y | 2009 | 2008 | 2007 |
|---|---|---|---|---|---|---|---|
| Initial Claims | 473 | 442 | 483 | -25.0% | 573 | 419 | 321 |
| Continuing Claims | -- | 4,563 | 4,563 | -7.8% | 5,835 | 3,345 | 2,552 |
| Insured Unemployment Rate (%) | -- | 3.5 | 3.5 | 3.8 (2/2009) | 4.4 | 2.5 | 1.9 |
by Tom Moeller February 18, 2010
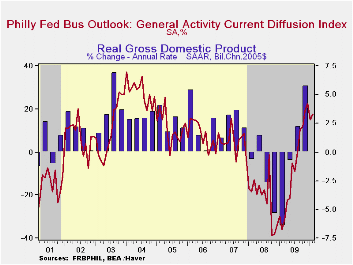 The
Philadelphia Federal Reserve Bank indicated that its index of regional
factory sector activity rose modestly this month and made up some of a
January decline. At 17.6 the index about matched Consensus expectations
and has been positive since the summer. The series was near its highest
level since early-2005 and compared to figures near -40.0 this past
fall and winter.
The
Philadelphia Federal Reserve Bank indicated that its index of regional
factory sector activity rose modestly this month and made up some of a
January decline. At 17.6 the index about matched Consensus expectations
and has been positive since the summer. The series was near its highest
level since early-2005 and compared to figures near -40.0 this past
fall and winter.
During the last ten years there has been a 77% correlation between the level of the Philadelphia Fed Business Conditions Index and the three-month growth in factory sector industrial production. There has been a 70% correlation with q/q growth in real GDP. The latest survey from the Philadelphia Federal Reserve Bank can be found here.
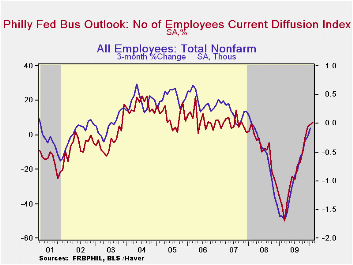
Amongst the components, new orders, shipments and inventories were notably strong above break-even. The employment series also rose to its highest since 2007. During the last ten years there has been a 91% correlation between the index level and the three-month change in manufacturing sector payrolls.
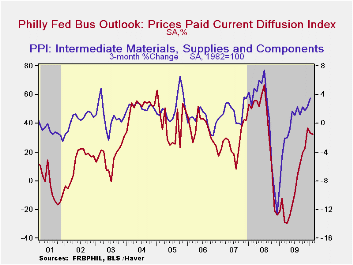
The prices paid index rose sharply to its highest level since August of last year and compares to negative readings this past winter and spring. During the last ten years there has been a 69% correlation between the prices paid index and the three-month growth in the intermediate goods PPI. There has been an 80% correlation with the change in core intermediate goods prices.
The separate index of expected business conditions in six months fell to its lowest level since October 2008. Many of the index components including orders, unfilled orders, delivery times and inventories fell while shipments and capital expenditures rose.
The figures from the Philadelphia Federal Reserve can be found in Haver's SURVEYS database.
News About the Future and Economic Fluctuations from the Federal Reserve Bank of Philadelphia can be found here.
| Philadelphia Fed (%) | February | January | December | February '09 | 2009 | 2008 | 2007 |
|---|---|---|---|---|---|---|---|
| General Activity Index | 17.6 | 15.2 | 22.5 | -36.1 | -7.6 | -21.4 | 5.0 |
| New Orders | 22.7 | 3.2 | 8.3 | -28.1 | -9.7 | -14.7 | 6.9 |
| Number of Employees | 7.4 | 6.1 | 4.5 | -41.1 | -23.8 | -8.8 | 6.8 |
| Inventories | 3.2 | -1.6 | -5.7 | -25.2 | -24.0 | -16.7 | -3.7 |
| Prices Paid Index | 32.4 | 33.2 | 36.6 | -12.2 | -3.9 | 36.3 | 26.3 |

Tom Moeller
AuthorMore in Author Profile »Prior to joining Haver Analytics in 2000, Mr. Moeller worked as the Economist at Chancellor Capital Management from 1985 to 1999. There, he developed comprehensive economic forecasts and interpreted economic data for equity and fixed income portfolio managers. Also at Chancellor, Mr. Moeller worked as an equity analyst and was responsible for researching and rating companies in the economically sensitive automobile and housing industries for investment in Chancellor’s equity portfolio. Prior to joining Chancellor, Mr. Moeller was an Economist at Citibank from 1979 to 1984. He also analyzed pricing behavior in the metals industry for the Council on Wage and Price Stability in Washington, D.C. In 1999, Mr. Moeller received the award for most accurate forecast from the Forecasters' Club of New York. From 1990 to 1992 he was President of the New York Association for Business Economists. Mr. Moeller earned an M.B.A. in Finance from Fordham University, where he graduated in 1987. He holds a Bachelor of Arts in Economics from George Washington University.
More Economy in Brief


