 Global| May 20 2008
U.S. PPI Gain Eased Last Month, Core Prices Firmed
by:Tom Moeller
|in:Economy in Brief
Summary
The increase in U.S. finished producer prices eased last month to 0.2% after the unrevised 1.1% spike during March. The latest gain fell short of Consensus expectations for a 0.4% rise and it was the lightest month to month increase [...]
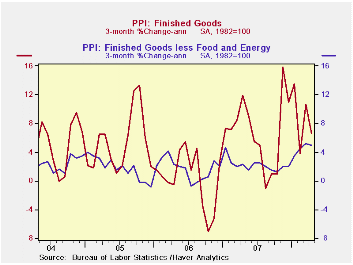
The increase in U.S. finished producer prices eased last month to 0.2% after the unrevised 1.1% spike during March. The latest gain fell short of Consensus expectations for a 0.4% rise and it was the lightest month to month increase this year.
The price gain's easing owed to a 0.2% (+17.1% y/y) decline in finished energy prices which was led by a 4.6% (+23.0% y/y) decline in gasoline prices. Elsewhere, energy prices were quite strong. Natural gas prices jumped 5.4% (9.1% y/y) and home heating oil prices increased 2.2% (48.6% y/y) after a 13.1% spike during March. Residential electric power prices also were strong and rose 1.2% (5.0% y/y).
Why Do Gasoline Prices React to Things That Have Not Happened? from the Federal Reserve Bank of St. Louis is available here.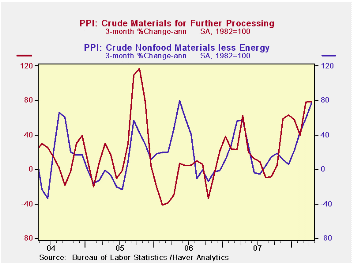
Past strength in finished consumer food prices took a breather and they were unchanged (5.1% y/y) after a 1.2% spike during March. The easing was led by a 12.3% (+39.7% y/y) decline in egg prices. Beef & veal prices also continued their recent weakness and fell 1.7% (-4.6% y/y) while fresh vegetable prices fell 4.1% (-16.2% y/y). Coffee prices fell 3.5% (+10.3% y/y). These declines were offset by higher prices for fish, turkeys and chicken.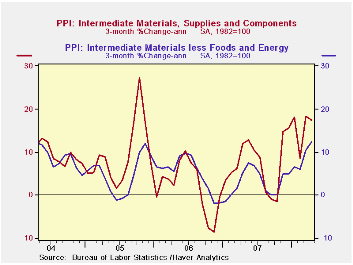
Less food & energy the increase in finished goods prices accelerated to 0.4% and that was faster than expectations for a 0.3% rise. Prices of core finished consumer goods rose 0.4% (3.6% y/y) due to more strength in nondurable prices which rose 0.3% (4.5% y/y). Durable consumer goods prices also were quite firm and rose 0.5% (2.3% y/y) due to a 0.9% (2.7% y/y) spike in household furniture prices while appliance prices increased 0.4% (0.9% y/y). Capital equipment prices also have firmed and rose 0.3% while the year to year gain rose to 2.3% from 1.4% as of last December.
Intermediate goods prices rose 0.9% after the 2.3% March surge. Excluding food & energy these prices spiked 1.2% due to 1.2% (8.7% y/y) jump in materials prices for manufacturing.
The crude materials PPI surged 3.2% further after the 8.0% March jump. Crude food prices took a breather after recent strength and fell 0.9% (+15.6% y/y). Energy materials prices jumped another 4.1% (52.0% y/y). The core crude materials PPI more than doubled its March increase and jumped 7.9% as prices for iron & steel scrap ballooned 32.2% (57.3% y/y).This morning's speech by Fed Vice Chairman Donald L. Kohn, The Economic Outlook, is available here.
| Producer Price Index (%) | April | March | Y/Y | 2007 | 2006 | 2005 |
|---|---|---|---|---|---|---|
| Finished Goods | 0.2 | 1.1 | 6.4 | 3.9 | 3.0 | 4.9 |
| Core | 0.4 | 0.2 | 3.0 | 1.9 | 1.5 | 2.4 |
| Intermediate Goods | 0.9 | 2.3 | 10.4 | 4.1 | 6.4 | 8.0 |
| Core | 1.2 | 1.1 | 5.8 | 2.8 | 6.0 | 5.5 |
| Crude Goods | 3.2 | 8.0 | 34.1 | 12.1 | 1.4 | 14.6 |
| Core | 7.9 | 3.5 | 24.5 | 15.7 | 20.8 | 4.9 |
by Tom Moeller May 20, 2008
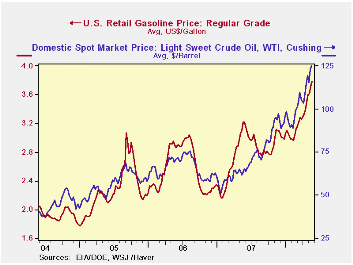
The retail price for a gallon of regular gasoline surged seven cents last week to $3.79 per gallon, according to the U.S. Department of Energy survey. That followed an eleven cent increase during the prior week. So far in May prices have risen 25 cents from the April average after that month's 21 cent jump.
During April, a 6.6% surge in the average price of gasoline translated into a 2.0% decline in prices in the April CPI report. The difference was due to seasonal factors. In the CPI report the data are seasonally adjusted and the factor "expected" a 7.7% increase based on historical April price patterns. For May, however, the gas price increase will boost the CPI as the seasonal expects a 3.6% increase and actual prices already risen by 7.3%. (These numbers don't work out exactly due to product type differences).
Spot market prices for gasoline rose further yesterday. The wholesale price for a gallon of non-oxygenated gasoline was $3.11 per gallon, up five cents from last week's average.
The price of a barrel of WTI crude oil rose ten dollars from the last week of April to $124.94. Yesterday prices rose further to a record $127.06.Natural gas prices recently have moved slightly lower. Yesterday's wholesale price of natural gas at $11.10 per mmbtu was down from Friday's record price and down from last week's average of $11.34/mmbtu. Prices are still nearly double this time last year.
Weekly gasoline prices can be found in Haver's WEEKLY database, daily prices are found in the DAILY database.FOMC Consensus Forecasts from the Federal Reserve Bank of St. Louis is available here.
| Weekly Prices | 05/19/08 | 05/05/08 | Y/Y | 2007 | 2006 | 2005 |
|---|---|---|---|---|---|---|
| Retail Gasoline ($ per Gallon) | 3.79 | 3.72 | 17.8% | 2.80 | 2.57 | 2.27 |
| Light Sweet Crude Oil, WTI ($ per bbl.) | 124.94 | 123.0 | 96.4% | 72.25 | 66.12 | 56.60 |
by Tom Moeller May 20, 2008
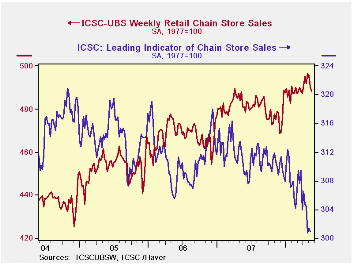
The ICSC-UBS retail chain-store sales index is constructed using the same-store sales (stores open for one year) reported by 78 stores of seven retailers: Dayton Hudson, Federated, Kmart, May, J.C. Penney, Sears and Wal-Mart.
During the latest week, the leading indicator of chain store sales from ICSC-UBS was roughly stable with the prior week but down 3.5% y/y.The chain store sales figures are available in Haver's SURVEYW database.
| ICSC-UBS (SA, 1977=100) | 05/16/08 | 05/09/08 | Y/Y | 2007 | 2006 | 2005 |
|---|---|---|---|---|---|---|
| Total Weekly Chain Store Sales | 488.3 | 490.3 | 1.6% | 2.8% | 3.3% | 3.6% |
by Tom Moeller May 20, 2008
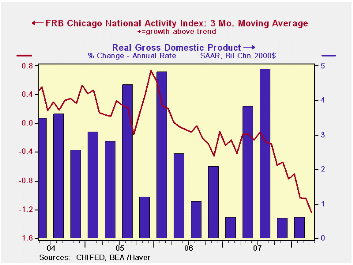
The April National Activity Index (CFNAI), published by the Chicago Federal Reserve Bank, fell to -1.17 after a slight improvement in March. The decline lowered the three month moving average of the figure to -1.24 which was its lowest level since the end of the 2001 recession.
A zero value of the CFNAI indicates that the economy is expanding at its historical trend rate of growth of roughly 3%. During the last twenty years there has been a 68% correlation between the level of the CFNAI and q/q growth in real GDP. An index level at or below -0.70 typically has indicated negative U.S. economic growth.
The complete CFNAI report is available here and the historical data are available in Haver's Surveys database.
Each of the four broad categories of indicators — employment, production, consumption and housing — continued to make negative contributions to the CFNAI during April.
The CFNAI is a weighted average of 85 indicators of economic activity. The indicators reflect activity in the following categories: production & income, the labor market, personal consumption & housing, manufacturing & trade sales, and inventories & orders.
Economic Trends and the Chicago Fed National Activity Index from the Federal Reserve Bank of Chicago is available here.
| Chicago Fed | April | March | April '07 | 2007 | 2006 | 2005 |
|---|---|---|---|---|---|---|
| CFNAI | -1.17 | -0.98 | -0.20 | -0.42 | -0.05 | 0.26 |
| 3-Month Average | -1.24 | -1.05 | -0.15 | -0.34 | -0.03 | 0.26 |
by Louise Curley May 20, 2008
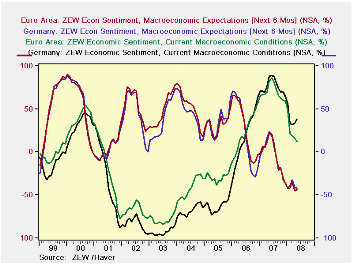
The Center for European Economic Research (ZEW) released today the results of its latest survey of some 300 analysts and institutional investors. While these representatives of the financial community reported an improvement in their appraisal of the current German situation, they down graded slightly their appraisal of its future. In May the percent balance between those who saw an improvement in the current situation and those who saw a worsening was 38.6%, up from 33.2% in April. The percent balance between those who saw a worsening of the outlook and whose who saw an improvement was -41.4%, 0.7 percentage points below the April balance of -40.7%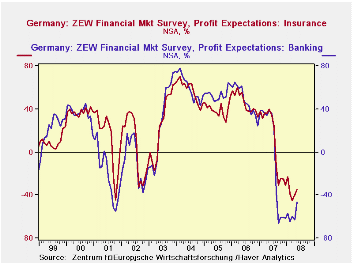
In addition to its survey of the financial community's opinions on Germany, ZEW also surveys their opinions of current conditions and expectations for the future of the Euro Area. The trends in opinions for the Euro Area in May were the opposite of those shown for Germany. In May the percent balance on those seeing an improvement over those seeing a deterioration in current conditions fell from 15.5% in April to 11.4% in May. and the percent balance between those expecting worsening of the outlook over those expecting an improvement decreased by 1.2 percentage points from -44.8 in April to -43.6 in May. The first chart shows the current conditions and expectations for the future for both Germany and the Euro Area. For the most part, there is a close correlation between the opinions for Germany and those for the Euro Area.
Although still negative, profit expectations in Germany have begun to improve, particularly in those industries that were hardest hit by the fallout from the sub prime crisis in the United States. The second chart shows the profit expectations for the banking and insurance industries.
| ZEW INDICATORS (% BALANCE) | May 08 | Apr 08 | May 07 | M/M Chg | Y/Y Chg | 2007 | 2006 | 2005 |
|---|---|---|---|---|---|---|---|---|
| Germany | ||||||||
| Current Conditions | 38.6 | 33.2 | 88.0 | 5.4 | -49.4 | 75.4 | 18.3 | -61.8 |
| Expectations | -41.4 | -40.7 | 24.0 | -0.7 | -65.4 | -3.0 | 22.3 | 34.8 |
| Euro Area | ||||||||
| Current Conditions | 11.4 | 15.5 | 86.8 | -4.1 | -70.4 | 70.0 | 23.8 | -29.7 |
| Expectations | -43.6 | -44.8 | 22.3 | 1.2 | -65.9 | -3.5 | 26.6 | 32.3 |

Tom Moeller
AuthorMore in Author Profile »Prior to joining Haver Analytics in 2000, Mr. Moeller worked as the Economist at Chancellor Capital Management from 1985 to 1999. There, he developed comprehensive economic forecasts and interpreted economic data for equity and fixed income portfolio managers. Also at Chancellor, Mr. Moeller worked as an equity analyst and was responsible for researching and rating companies in the economically sensitive automobile and housing industries for investment in Chancellor’s equity portfolio. Prior to joining Chancellor, Mr. Moeller was an Economist at Citibank from 1979 to 1984. He also analyzed pricing behavior in the metals industry for the Council on Wage and Price Stability in Washington, D.C. In 1999, Mr. Moeller received the award for most accurate forecast from the Forecasters' Club of New York. From 1990 to 1992 he was President of the New York Association for Business Economists. Mr. Moeller earned an M.B.A. in Finance from Fordham University, where he graduated in 1987. He holds a Bachelor of Arts in Economics from George Washington University.
More Economy in Brief


