 Global| Feb 19 2009
U.S. PPI Firmer Than Expected
by:Tom Moeller
|in:Economy in Brief
Summary
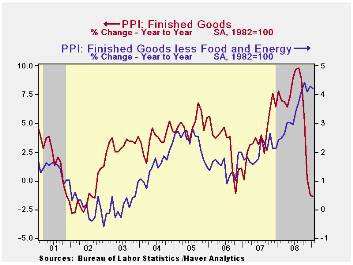
U.S. producer prices for finished goods rose 0.8% during January following five consecutive months of sharp decline. Despite the latest monthly increase, however, the year-to-year change of -1.3% was the softest since late 2002. A [...]
 U.S.
producer prices for finished goods rose 0.8% during January following
five consecutive months of sharp decline. Despite the latest monthly
increase, however, the year-to-year change of -1.3% was the softest
since late 2002.
U.S.
producer prices for finished goods rose 0.8% during January following
five consecutive months of sharp decline. Despite the latest monthly
increase, however, the year-to-year change of -1.3% was the softest
since late 2002.
A 3.7% rise (-19.2% y/y) in finished energy prices was responsible for much of the lift to the January PPI. It reversed some of a 9.1% December drop. The increase was the first rise in energy costs in six months and was led by a 15.3% pop (-45.0% y/y) in gasoline prices. Home heating oil prices rose a lesser 1.6% (-41.7% y/y) but natural gas prices fell 1.5% (+4.5% y/y).
Lower finished food prices offset some of the upward lift from energy costs. The 0.4% January decline lowered the year-to-year increase to 2.0% from its high of 9.1% this past summer. The moderation in food price inflation occurred because of a 6.2% annual rate of decline in overall food prices during the last three months. The drop was led by lower meat, vegetable and dairy product costs.
 Less food
& energy, prices were strong
last month. The 0.4% increase in PPI less food and fuels was double
expectations and followed two months of 0.1% and 0.2% gain.
Year-to-year the gains have been firm, stable (above 4.0% since
September) and apparently insensitive to the economic
downturn. Prices of core finished consumer goods rose 0.4%
last month and the annual rate of gain was 4.2%. Durable consumer goods
prices also jumped 0.4% in January and were up 3.1% y/y.
Appliance prices surged 3.9% y/y, nearly their strongest since 1989,
while core nondurable goods prices strengthened to a 5.4% y/y increase,
also near the fastest rise since early 1999. In addition,
prices for capital equipment firmed and rose 4.0%, again the strongest
since 1989.
Less food
& energy, prices were strong
last month. The 0.4% increase in PPI less food and fuels was double
expectations and followed two months of 0.1% and 0.2% gain.
Year-to-year the gains have been firm, stable (above 4.0% since
September) and apparently insensitive to the economic
downturn. Prices of core finished consumer goods rose 0.4%
last month and the annual rate of gain was 4.2%. Durable consumer goods
prices also jumped 0.4% in January and were up 3.1% y/y.
Appliance prices surged 3.9% y/y, nearly their strongest since 1989,
while core nondurable goods prices strengthened to a 5.4% y/y increase,
also near the fastest rise since early 1999. In addition,
prices for capital equipment firmed and rose 4.0%, again the strongest
since 1989.
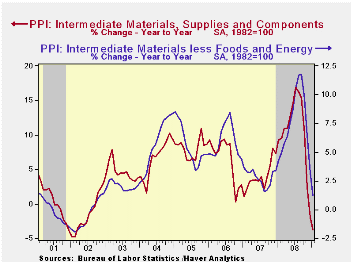
As was the case last month, lower prices for intermediate goods may portend softer gains in finished goods prices coming down the pike. Intermediate goods prices fell 0.7% during January and are down 3.7% year-to-year, the weakest since 2002. Excluding food & energy, prices fell for the fourth consecutive month and the 1.1% drop left the year-to-year change at 1.2%. Core prices increased 7.6% during all of last year.
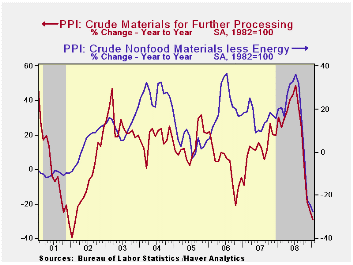 The
crude materials PPI fell for the sixth straight month and is the most
sensitive to current weakness in the economy. The 2.9% decline in the
total was led by an 8.1% drop (-39.8% y/y) in energy
prices. Crude food prices did rise by 1.0% last month but
year-to-year they fell 15.5%. Less food & energy, January crude
prices ticked higher by 0.1% following five months of sharp decline.
The
crude materials PPI fell for the sixth straight month and is the most
sensitive to current weakness in the economy. The 2.9% decline in the
total was led by an 8.1% drop (-39.8% y/y) in energy
prices. Crude food prices did rise by 1.0% last month but
year-to-year they fell 15.5%. Less food & energy, January crude
prices ticked higher by 0.1% following five months of sharp decline.
The Producer Price Index data is available in Haver's USECON database. More detailed data is in the PPI and in the PPIR databases.
Federal Reserve Policies to Ease Credit and Their Implications for the Fed's Balance Sheet is yesterday's speech by Federal Reserve Chairman Ben S. Bernanke and it can be found here.
The Federal Reserve on Wednesday released, for the first time, longer-run economic projections made by Federal Open Market Committee (FOMC) participants--the Federal Reserve Board members and Federal Reserve Bank presidents--in connection with their regular quarterly projections. The release can be found here.
| Producer Price Index (%) | January | December | Y/Y | 2008 | 2007 | 2006 |
|---|---|---|---|---|---|---|
| Finished Goods | 0.8 | -1.9 | -1.3 | 6.4 | 3.9 | 2.9 |
| Core | 0.4 | 0.2 | 4.2 | 3.4 | 2.0 | 1.5 |
| Intermediate Goods | -0.7 | -4.2 | -3.7 | 10.5 | 4.0 | 6.4 |
| Core | -1.1 | -2.9 | 1.2 | 7.6 | 2.8 | 6.0 |
| Crude Goods | -2.9 | -5.3 | -28.9 | 21.2 | 11.9 | 1.4 |
| Core | 0.1 | -2.2 | -27.8 | 15.0 | 15.6 | 20.8 |
by Robert Brusca February 19, 2009
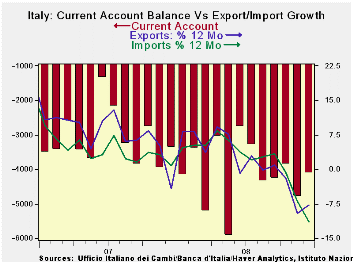
Italy’s exports fell in December but imports plunged helping to boost the trade account and to shift the balance of trade on goods into surplus in December. Italy’s current account deficit is still on a deteriorating trend, even with the improvement in December. And despite the December performance of exports, both exports and imports are on similarly plunging trends over 3-mos 6-mos and 12 mos. Imports are falling faster over most horizons except the most recent ones. Now the three-month export growth rate is just as bad as the rate of imports. Italy’s services exports flows are doing much worse than imports. Recession generally reigns in imports as we are seeing here. Italy’s weak exports are a function of recessions in its trade partners.
| Italy's Trade Trends | |||||||
|---|---|---|---|---|---|---|---|
| m/mo % monthly rate | Period Specified saar | ||||||
| Dec-08 | Nov-08 | Oct-08 | 3-MO | 6-Mo | 12-Mo | Yr-Ago | |
| Current Account Bal | €€ (4,121) | €€ (4,787) | €€ (3,854) | €€ (4,254) | €€ (4,107) | €€ (4,092) | €€ (3,114) |
| Goods Balance | €€ 132 | €€ (676) | €€ 716 | €€ 57 | €€ (341) | €€ 61 | €€ 251 |
| Exports | -0.7% | -10.6% | 0.7% | -36.1% | -6.6% | 1.6% | -4.4% |
| Imports | -3.4% | -6.4% | -1.7% | -37.5% | -11.5% | -2.5% | -0.1% |
| Services Balance | €€ (1,074) | €€ (849) | €€ (1,747) | €€ (1,223) | €€ (846) | €€ (636) | €€ (583) |
| Exports | -0.2% | -12.3% | 1.7% | -37.2% | -0.3% | -7.7% | 15.2% |
| Imports | 2.8% | -19.4% | 15.5% | -16.4% | 18.7% | 4.5% | 8.5% |
by Tom Moeller February 19, 2009
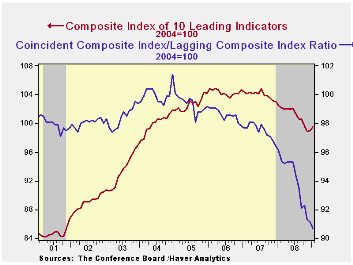
For January, the Conference Board reported that the composite index of leading economic indicators rose 0.4% after a revised 0.2% December increase. The peak index level occurred in July of last year and the six-month rate of decline has improved slightly.
Five of the ten components of the leading index rose last
month with the largest positive contributions coming from faster money
supply growth, a steeper yield curve and higher consumer expectations.
These gains were offset by lower stock prices, lower building permits
and higher claims for unemployment insurance.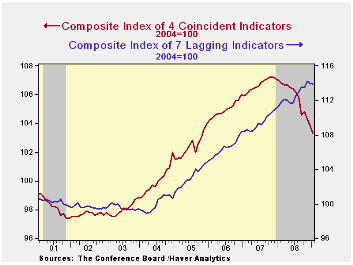
The breadth of one-month increase amongst the leaders' 10 components improved to 50% but over a six-month period the breadth of gain amongst the components remained stuck at a quite low 30%.
The leading index is based on actual reports for eight economic data series. The Conference Board initially estimates two series, orders for consumer goods and orders for capital goods.
Reflecting the recession, the coincident indicators dropped sharply again. For the third month in a row, the index fell 0.5%. Half of the four component series fell with outsized drops registered by employment and production. Year-to-year the coincident indicators fell 3.5% and over the last ten years there has been a 76% correlation between this y/y change and real GDP.
The lagging index fell 0.1% after a 0.2% December decline. The ratio of coincident-to-lagging indicators (a measure of economic excess) fell further to its lowest level since 1975.
The Conference Board figures are available in Haver's BCI database. Visit the Conference Board's site for coverage of leading indicator series from around the world.
The minutes to the latest meeting of the Federal Open Market Committee are available here.
| Business Cycle Indicators (%) | January | December | November | Oct. 6-Month % (AR) | 2008 | 2007 | 2006 |
|---|---|---|---|---|---|---|---|
| Leading | 0.4 | 0.2 | -0.7 | -3.7 | -2.8 | -0.3 | 1.5 |
| Coincident | -0.5 | -0.5 | -0.5 | -5.4 | -0.8 | 1.6 | 2.5 |
| Lagging | -0.1 | -0.2 | 0.6 | 2.5 | 2.9 | 2.8 | 3.3 |
by Tom Moeller February 19, 2009
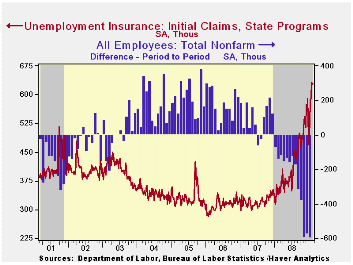
The U.S. labor market continued quite weak as the Labor Department indicated that initial claims for unemployment insurance remained stable last at 627,000. The prior week's figure was revised up slightly. The latest level again surpassed Consensus expectations for 620,000 initial claims. Initial claims continue to be the highest since late during the sharp recession of 1981-82. During that recession, real GDP fell by 2.9% peak-to-trough.
The latest initial claims figure is for the survey week for
February nonfarm payrolls. Claims rose 42,000, or 7.2%, from the
January survey period. During the last ten years there has been an 83%
(negative) correlation between the level of claims and the
month-to-month change in nonfarm payrolls.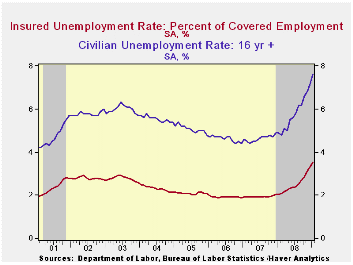
The Labor Department indicated that in the week ending
February 7, the largest increases in claims were in Kentucky (+8,419),
Arkansas (+4,142), Illinois (+3,630), Texas (+3,392), and Missouri
(+3,217), while the largest decreases were in California (-5,249),
Tennessee (-1,718), Iowa (-1,413), Connecticut (-1,267), and South
Carolina
(-1,059).
Labor market stress was further indicated by a huge 170,000 increase in continuing claims for unemployment insurance to 4,987,000. The latest was another record. The series dates back to 1966. The four-week average of continuing claims rose 92,500 to 4,839,500. Continuing claims provide some indication of workers' ability to find employment and they lag the initial claims figures by one week.
Though the latest level of continuing claims was a record, the labor force has grown as well, by more than 27% over the last twenty years. Therefore, the insured rate of unemployment was not at a new high. It ticked up to 3.7% which was the highest since 1983. During the last ten years there has been a 93% correlation between the level of the insured unemployment rate and the overall rate of unemployment published by the Bureau of Labor Statistics. The lower level of the insured unemployment rate versus the BLS figure reflects, among other things, the self-employed. The highest insured unemployment rates during the week ended January 31 were in Michigan (8.1 percent), Idaho (7.0), Oregon (7.0), Pennsylvania (6.4), Wisconsin (6.3), Nevada (5.9), Alaska (5.8), Montana (5.6), Rhode Island (5.6), and Indiana (5.5).
The unemployment insurance claim data is available in Haver's USWEEKLY database.
Deciphering the Liquidity and Credit Crunch 2007-08, published by the University of Princeton, can be found here.
| Unemployment Insurance (000s) | 02/13/09 | 02/06/09 | 01/30/09 | Y/Y | 2008 | 2007 | 2006 |
|---|---|---|---|---|---|---|---|
| Initial Claims | 627 | 627 | 631 | 83.3% | 420 | 321 | 313 |
| Continuing Claims | -- | 4,987 | 4,817 | 79.8% | 3,342 | 2,552 | 2,459 |

Tom Moeller
AuthorMore in Author Profile »Prior to joining Haver Analytics in 2000, Mr. Moeller worked as the Economist at Chancellor Capital Management from 1985 to 1999. There, he developed comprehensive economic forecasts and interpreted economic data for equity and fixed income portfolio managers. Also at Chancellor, Mr. Moeller worked as an equity analyst and was responsible for researching and rating companies in the economically sensitive automobile and housing industries for investment in Chancellor’s equity portfolio. Prior to joining Chancellor, Mr. Moeller was an Economist at Citibank from 1979 to 1984. He also analyzed pricing behavior in the metals industry for the Council on Wage and Price Stability in Washington, D.C. In 1999, Mr. Moeller received the award for most accurate forecast from the Forecasters' Club of New York. From 1990 to 1992 he was President of the New York Association for Business Economists. Mr. Moeller earned an M.B.A. in Finance from Fordham University, where he graduated in 1987. He holds a Bachelor of Arts in Economics from George Washington University.
More Economy in Brief


