 Global| Sep 12 2008
U.S. PPI Fell With Lower Gasoline Prices, Core Pricing Power Strong
by:Tom Moeller
|in:Economy in Brief
Summary
U.S. finished producer prices declined 0.9% during July following a revised 1.2% increase during June. The decline was roughly double Consensus expectations for a 0.5% drop. Lower energy prices pulled the overall PPI down with a 4.6% [...]
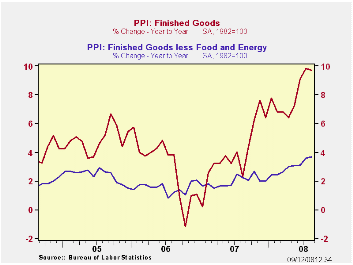
U.S. finished producer prices declined 0.9% during July following a revised 1.2% increase during June. The decline was roughly double Consensus expectations for a 0.5% drop.
Lower energy prices pulled the overall PPI down with a 4.6% (+27.4% y/y) drop. Gasoline prices fell 3.5% but they remained up by nearly one half from July of last year. Natural gas prices also fell by 5.0% (+25.4% y/y). Residential electric power costs inched up 0.1% (+6.2% y/y).
For the second consecutive month finished consumer food prices rose 0.3% (9.2% y/y). Beef and veal broke out to the upside with a 1.6% (19.0% y/y) rise on the heels of a 7.4% July jump. Pork prices also were quite strong with a 10.1% (10.2% y/y) jump. Countering some of this strength was a 1.2% (+0.1% y/y) decline in dairy product prices and though fresh vegetable prices fell 14.3%, they remained up (9.6% y/y). Finally, prices for pasta products inched up just 0.1% but they're up 39.8% y/y.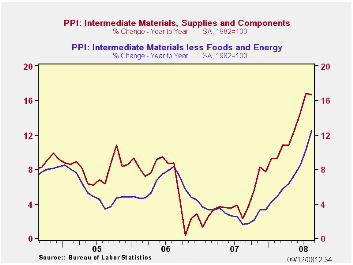
Less food & energy the gain in prices eased to 0.2% after the 0.7% jump during July. The latest figure matched expectations. The momentum in core producer prices has, however, picked up. The 3.7% y/y increase is the strongest since early-1991. Prices of core finished consumer goods rose 0.2% and that lifted y/y growth in these prices to 4.0%, the strongest gain in ten years. Durable consumer goods prices fell 0.1% (+2.0% y/y) but core nondurable goods prices rose 0.6% (5.6% y/y) for the second consecutive month. Finally, though capital equipment prices inched up just 0.1%, that followed a 0.8% jump during July and the 3.2% y/y increase was the strongest since 1991.
Intermediate goods prices fell 1.0% with lower energy prices. That reversed some of the prior month's 2.7% rise. Excluding food & energy, however, these prices remained firm and they posted a 1.7% increase. The y/y gain of 12.5% was the strongest since 1980.
The crude materials PPI flopped 11.9% (+38.2% y/y) due to a 19.4% drop in energy prices. However, these prices still are up by more than one half year-to-year. Crude food prices fell 5.2% (+15.2% y/y). Less food & energy crude prices fell all of 1.9%. While that reversed most of the 3.4% July increase, the year-to-year gain of 33.5% is a near-record rise.
| Producer Price Index (%) | August | July | Y/Y | 2007 | 2006 | 2005 |
|---|---|---|---|---|---|---|
| Finished Goods | -0.9 | 1.2 | 9.7 | 3.9 | 3.0 | 4.9 |
| Core | 0.2 | 0.7 | 3.7 | 1.9 | 1.5 | 2.4 |
| Intermediate Goods | -1.0 | 2.7 | 16.7 | 4.1 | 6.4 | 8.0 |
| Core | 1.7 | 2.0 | 12.5 | 2.8 | 6.0 | 5.5 |
| Crude Goods | -11.9 | 4.2 | 38.2 | 12.1 | 1.4 | 14.6 |
| Core | -1.9 | 3.4 | 33.5 | 15.6 | 20.8 | 4.9 |

Tom Moeller
AuthorMore in Author Profile »Prior to joining Haver Analytics in 2000, Mr. Moeller worked as the Economist at Chancellor Capital Management from 1985 to 1999. There, he developed comprehensive economic forecasts and interpreted economic data for equity and fixed income portfolio managers. Also at Chancellor, Mr. Moeller worked as an equity analyst and was responsible for researching and rating companies in the economically sensitive automobile and housing industries for investment in Chancellor’s equity portfolio. Prior to joining Chancellor, Mr. Moeller was an Economist at Citibank from 1979 to 1984. He also analyzed pricing behavior in the metals industry for the Council on Wage and Price Stability in Washington, D.C. In 1999, Mr. Moeller received the award for most accurate forecast from the Forecasters' Club of New York. From 1990 to 1992 he was President of the New York Association for Business Economists. Mr. Moeller earned an M.B.A. in Finance from Fordham University, where he graduated in 1987. He holds a Bachelor of Arts in Economics from George Washington University.
More Economy in Brief


