 Global| Nov 18 2008
U.S. PPI Fell Again, Core Pricing Power Strong Again
by:Tom Moeller
|in:Economy in Brief
Summary
U.S. finished producer prices during October matched Consensus expectations and fell 2.8% following their 0.4% drop during September. A 12.8% decline in energy prices (+5.5% y/y) was due to a 24.9% plunge in gasoline prices, but [...]
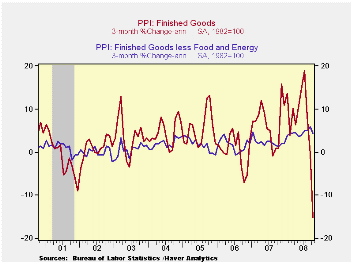
U.S. finished producer prices during October matched Consensus expectations and fell 2.8% following their 0.4% drop during September.
A 12.8% decline in energy prices (+5.5% y/y) was due to a
24.9% plunge in gasoline prices, but gasoline prices were still up 3.2%
y/y. Additionally, home heating oil prices fell by 9.6% (+24.2% y/y).
Natural gas prices fell for the third consecutive month but, again, a
5.9% gain left them still up 10.4% y/y. Residential electric power
costs slipped 0.5% (+5.8% y/y).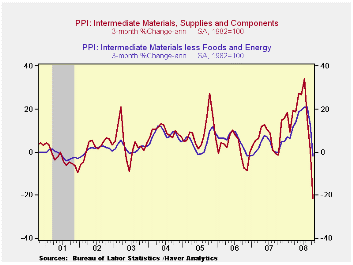
Less food & energy, prices rose 0.4% for the second consecutive month and that compared to a Consensus expectation for a 0.1% uptick. Core pricing indeed has firmed. The y/y gain in the core PPI of 4.4% was the strongest since late-1989. Prices of core finished consumer goods rose 0.3% last month and that was enough to lift the y/y gain to 4.6%, its strongest since 1989. Durable consumer goods prices rose 0.4% (3.0% y/y) on the strength of higher furniture prices which increased 5.4% y/y after a 1.3% gain last year. Additionally, appliance prices firmed and posted a 2.9% y/y rise following the 1.1% increase during 2007. Core nondurable goods prices also strengthened and rose 0.3% last month. Their 5.8% y/y gain was the fastest since early 1999. Prices for capital equipment also firmed. A 0.5% rise during October was the second in a row and it raised the y/y rise to 4.4%, the strongest since 1989.
Finished consumer food prices reversed their September gain
and fell 0.2%. However, they still have been strong. Rising 6.6% y/y
food prices about matched last year's gain which was up from a 0.7%
uptick during 2006. Meat prices have been firm as have been bakery
product prices.
Intermediate goods prices fell 3.9% as energy prices dropped. However, excluding food & energy a 1.7% m/m fall still left these prices up 9.7% y/y which remained near the strongest since 1980.
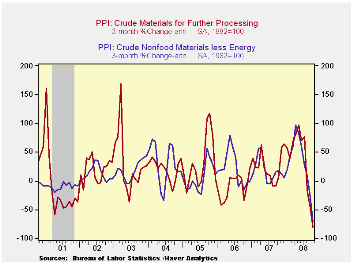
The crude materials PPI crashed 18.6% (-1.4% y/y) due to a 24.9% drop in energy prices (-1.7% y/y). Crude food prices fell 11.1% and that was enough to lower the y/y gain to -1.3% y/y. Less food & energy crude prices fell 17.0% and that pushed the y/y gain into negative territory for the first time since 2005.
This morning's testimony by Fed Chairman Ben S. Bernanke is available here.
| Producer Price Index (%) | October | September | Y/Y | 2007 | 2006 | 2005 |
|---|---|---|---|---|---|---|
| Finished Goods | -2.8 | -0.4 | 5.1 | 3.9 | 3.0 | 4.9 |
| Core | 0.4 | 0.4 | 4.4 | 1.9 | 1.5 | 2.4 |
| Intermediate Goods | -3.9 | -1.2 | 15.3 | 4.1 | 6.4 | 8.0 |
| Core | -1.7 | -0.3 | 9.7 | 2.8 | 6.0 | 5.5 |
| Crude Goods | -18.6 | -7.9 | -1.4 | 12.1 | 1.4 | 14.6 |
| Core | -17.0 | -9.4 | -3.1 | 15.6 | 20.8 | 4.9 |
by Tom Moeller November 18, 2008
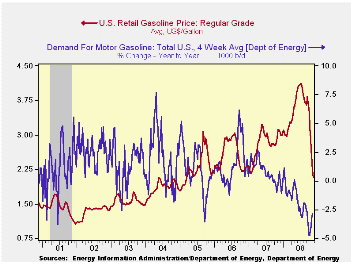
Falling by another fifteen cents w/w to $2.07 per gallon, the retail price for a gallon of regular gasoline was at its lowest level since early 2005 according to the U.S. Department of Energy survey. Prices have now fallen $2.04 per gallon, or by more than one-half, since their peak early this past July. The latest decline was accompanied by a drop in the average price for all grades of gasoline to $2.13 per gallon.
Yesterday, the spot market price for a gallon of regular
gasoline fell eight cents from last week's average to $1.24. In futures
trading the November contract closed down further at $1.17 per gallon.
Weekly gasoline prices can be found in Haver's WEEKLY database. Daily prices are in the DAILY database.
The U.S. Department of Energy reported that the demand for gasoline fell by 2.9% y/y. The rate of decline has bottomed out recently but the decline is still the fastest since late-1995 (the latest four weeks versus the same four weeks last year). The demand for all petroleum products also has softened, falling 6.6% y/y.
These DOE figures are available in Haver's OILWKLY database.
The price for a barrel of West Texas Intermediate crude oil fell further last week to an average $58.64 per barrel, down 60% since the peak in July of $145.66. In futures trading yesterday, the two-month price for crude oil was even lower at $54.95 per barrel.
Last week, prices for natural gas reversed the prior week's gain and ticked down to $6.65 per mmbtu (-7.4% y/y). The average price this month was nearly one-half below the high for natural gas prices in early-July of $13.19/mmbtu.
Signs of a Reprieve from the Federal Reserve Bank of Dallas can be found here.
Monetary Policy Transparency and Private Sector Forecasts: Evidence from Survey Data from the Federal Reserve Bank of Kansas City is available here.
| Weekly Prices | 11/17/08 | 11/10/08 | Y/Y | 2007 | 2006 | 2005 |
|---|---|---|---|---|---|---|
| Retail Regular Gasoline ($ per Gallon) | 2.07 | 2.22 | -33.1% | 2.80 | 2.57 | 2.27 |
| Light Sweet Crude Oil, WTI ($ per bbl.) | 58.64 | 64.31 | -37.4% | 72.25 | 66.12 | 56.60 |
by Tom Moeller November 18, 2008
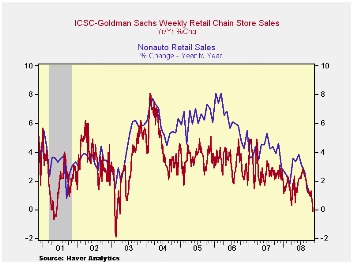
According to the International Council of Shopping Centers-Goldman Sachs Index, a 0.3% uptick in chain store sales last week made up a piece of the prior week's 1.0% decline. Nevertheless, sales ticked down 0.1% from the year-ago level.
The latest weekly increase left sales so far in November down 0.6% from October. During all of October sales fell 1.0% from September following that month's 1.9% drop. The level of sales during the latest week remained near the lowest since December of last year. During the last ten years there has been a 59% correlation between the y/y change in chain store sales and the change in nonauto retail sales less gasoline.The ICSC-Goldman Sachs retail chain-store sales index is constructed using the same-store sales (stores open for one year) reported by 78 stores of seven retailers: Dayton Hudson, Federated, Kmart, May, J.C. Penney, Sears and Wal-Mart.
The weekly leading indicator of chain store sales from ICSC-Goldman Sachs ticked up 0.1% but was still down 5.7% from the year-ago level and it was at it's lowest level since 1996.
The chain store sales figures are available in Haver's SURVEYW database.
| ICSC-UBS (SA, 1977=100) | 11/15/08 | 11/08/08 | Y/Y | 2007 | 2006 | 2005 |
|---|---|---|---|---|---|---|
| Total Weekly Chain Store Sales | 478.5 | 477.2 | -0.1% | 2.8% | 3.3% | 3.6% |
by Tom Moeller November 18, 2008
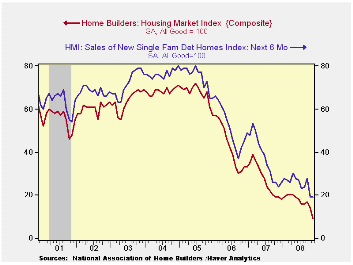
The November Housing Market Index (HMI) from the National Association of Home Builders plumbed a new record low. At a single level of 9 nearly halved the old record low of 14 reached just last month. The index is compiled from survey questions asking builders to rate market conditions as “good”, “fair”, “poor” or “very high” to “very low”. Numerical equivalent results over 50 indicate a predominance of “good” readings.
Since 1990, the year-to-year change in this index has had a correlation of 72% with the year-to-year percentage change in new single-family home sales. As a result, the latest HMI index at best indicates a bottoming of the housing market's troubles.
The Home Builders Association indicated that its sub-index of present sales conditions also fell to a record low of 8. That was down from last year's average level of 27 and 2006's average of 45.
Builders’ expectations for sales six months was relatively
strong an held steady at a level of 19. The
“traffic of prospective buyers, however, fell to a new low index
reading of 7.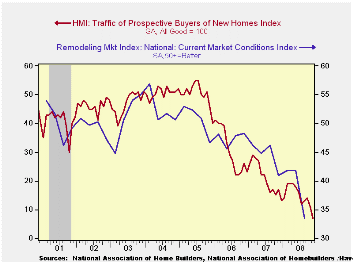
Each of the country's regions showed deterioration in the index as conditions in each region fell to a new low.
Not only are builders disturbed by the market for new homes, but the appraisal of conditions for remodeling a home also reached a record low during the third quarter.
The current market condition for remodeling of a home also is deemed poor.
The NAHB has compiled the Housing Market Index since 1985. The weights assigned to the individual index components are .5920 for single family detached sales, present time; .1358 for single family detached sales, next six months; and .2722 for traffic of prospective buyers. The results, along with other housing and remodeling indexes from NAHB Economics, are included in Haver’s SURVEYS database.
Mortgage Innovation, Mortgage Choice, and Housing Decisions from the Federal Reserve Bank of St. Louis can be found here.
Changing the Rule: State Mortgage Foreclosure Moratoria During the Great Depression is available here.
| Nat'l Association of Home Builders | November | October | November '07 | 2007 | 2006 | 2005 |
|---|---|---|---|---|---|---|
| Composite Housing Market Index | 9 | 14 | 19 | 27 | 42 | 67 |
by Louise Curley November 18, 2008
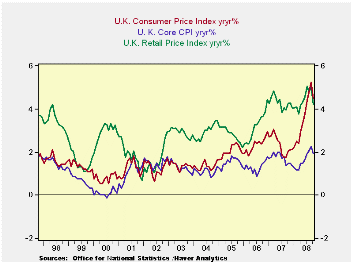 The
United Kingdom released inflation numbers today. The
acceleration in inflation in the previous months came to a halt in
October. The official measure, the year- to- year percent
change in the consumer price index, fell to 4.5% in October from 5.2%
in September. The core index, which excludes
energy, food, alcoholic beverages and tobacco, fell to 1.9% in October
from 2.2%. The year- to- year change in the retail price
index, which until 2003 was the official measure of inflation, fell to
4.2% in October from 5.00% in September. The three measures of
inflation are shown in the first chart.
The
United Kingdom released inflation numbers today. The
acceleration in inflation in the previous months came to a halt in
October. The official measure, the year- to- year percent
change in the consumer price index, fell to 4.5% in October from 5.2%
in September. The core index, which excludes
energy, food, alcoholic beverages and tobacco, fell to 1.9% in October
from 2.2%. The year- to- year change in the retail price
index, which until 2003 was the official measure of inflation, fell to
4.2% in October from 5.00% in September. The three measures of
inflation are shown in the first chart.
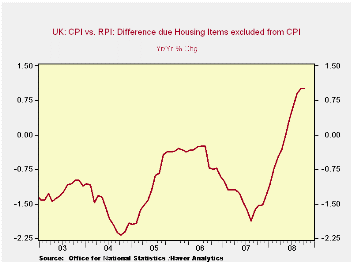
Except for the last two months, the inflation rate as measured by the CPI has been lower than that measured by the RPI largely because of the exclusion in the former and inclusion in the latter of mortgage interest payments and other housing related costs. Until June of this year the exclusion of these items tended to lower the CPI inflation rate, but since then it has added to it, as can be seen in the second chart.
The declines in the various measures of inflation were due largely to the declines in the prices of food and oil that affected the indexes directly and declines in the prices of base metals that affected the indexes indirectly. The declines are likely to continue, if not intensify, as world demand continues to fall. Longer term, however, the current fiscal and monetary policies being pursued by the developed and developing nations should help to avoid deflation such as engulfed the globe in the thirties. ( If, indeed, they do not lead eventually to a resurgence of inflation.) As an illustration of the course of inflation and deflation in the twenties and thirties of the last century, we use the changes in the consumer price index for the United States, the series, PCUN67, found in the Haver Analytics' USECON data base.
| UNITED KINGDOM INFLATION RATES | Oct 08 | Sep 08 | Oct 07 | M/M Chg | Y/Y Chg | 2007 | 2006 | 2005 |
|---|---|---|---|---|---|---|---|---|
| Consumer Price Index (Y/Y % Chg) | 4.5 | 5.2 | 2.0 | -0.7 | 2.5 | 2.32 | 2.33 | 2.05 |
| Core CPI Index (Y/Y % Chg) | 1.9 | 2.2 | 1.5 | -0.3 | 0.4 | 1.69 | 1.30 | 1.51 |
| Retail Price Index (Y/Y % Chg) | 4.2 | 5.0 | 4.2 | -0.8 | 0.0 | 4.27 | 3.19 | 2.83 |

Tom Moeller
AuthorMore in Author Profile »Prior to joining Haver Analytics in 2000, Mr. Moeller worked as the Economist at Chancellor Capital Management from 1985 to 1999. There, he developed comprehensive economic forecasts and interpreted economic data for equity and fixed income portfolio managers. Also at Chancellor, Mr. Moeller worked as an equity analyst and was responsible for researching and rating companies in the economically sensitive automobile and housing industries for investment in Chancellor’s equity portfolio. Prior to joining Chancellor, Mr. Moeller was an Economist at Citibank from 1979 to 1984. He also analyzed pricing behavior in the metals industry for the Council on Wage and Price Stability in Washington, D.C. In 1999, Mr. Moeller received the award for most accurate forecast from the Forecasters' Club of New York. From 1990 to 1992 he was President of the New York Association for Business Economists. Mr. Moeller earned an M.B.A. in Finance from Fordham University, where he graduated in 1987. He holds a Bachelor of Arts in Economics from George Washington University.
More Economy in Brief


