 Global| Mar 17 2010
U.S. PPI Falls With Weak Energy& Core Prices
by:Tom Moeller
|in:Economy in Brief
Summary
Producer price inflation eased last month. The finished goods PPI fell 0.6% after its strong 1.4% increase during January. Nevertheless, the 4.6% y/y gain remained nearly the strongest since the autumn of 2008. The February decline [...]
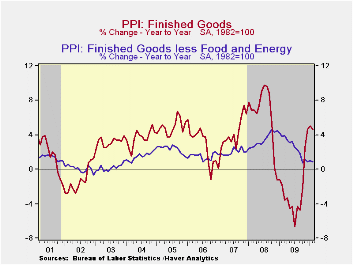
Producer price inflation eased last month. The finished goods PPI fell 0.6% after its strong 1.4% increase during January. Nevertheless, the 4.6% y/y gain remained nearly the strongest since the autumn of 2008. The February decline exceeded Consensus expectations for a 0.2% dip.
Lower energy prices were behind the decline in the PPI. Their 2.9% drop reversed some of the 5.1% January increase but left energy prices 17.7% higher than last year. A 7.4% decline (+48.7% y/y) in gasoline prices led the weakness and reversed most of the 11.5% January gain. Home heating oil prices also fell sharply. However, their 5.6% decline (+29.3% y/y) still left the annual gain at its strongest since the fall of 2008. Finally, natural gas prices rose a modest 0.8% (-8.0% y/y) and electricity prices rose 0.4% (-1.0% y/y).
Finished food prices repeated their 0.4% January increase. Their resulting 3.4% y/y increase was the strongest since December 2008. Severe weather caused a one-third y/y increase in prices for fresh fruits while egg prices (16.5% y/y) and pork prices (14.1% y/y) have been similarly firm. These strong gains have been offset by weak beef prices and declines in bakery, rice and pasta product prices.
Finished producer prices excluding food & energy edged up an expected 0.1%. The resulting 0.9% y/y increase was nearly the weakest since early-2004. The PPI for finished consumer goods less food & energy rose just 0.2% (1.7% y/y) following a 0.4% January gain. Finished durables prices edged up 0.1% (0.6% y/y) while core finished consumer nondurable goods prices gained 0.2% (2.4% y/y), their weakest since October. Capital equipment prices slipped 0.1% (+0.1% y/y) reflecting weakness amongst most products.
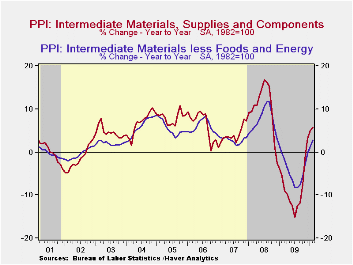
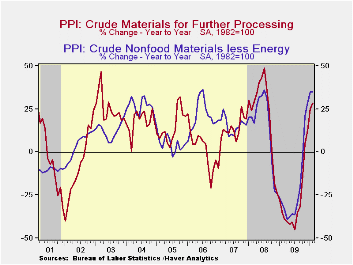
Prices for intermediate goods rose just 0.1% reflecting a 2.7% decline (+19.6% y/y) in energy and a 0.4% decline (+2.3% y/y) in food. The increase in core prices, however, moved higher to 0.9% and the 2.8% y/y increase was the strongest since December 2008. The crude materials PPI fell 3.5% due to a 6.4% decline (+49.8% y/y) in energy prices. Core crude prices were led modestly lower due to a 7.4% decline (+59.7% y/y) in aluminum prices. Versus last year copper prices also have been strong and doubled while iron & steel scrap prices have risen by two-thirds.
The producer price data is available in Haver's USECON database. More detailed data is in the PPI and in the PPIR databases.
| Producer Price Index(%) | February | January | December | Y/Y | 2009 | 2008 | 2007 |
|---|---|---|---|---|---|---|---|
| Finished Goods | -0.6 | 1.4 | 0.4 | 4.6 | -2.5 | 6.4 | 3.9 |
| Less Food & Energy | 0.1 | 0.3 | 0.0 | 0.9 | 2.6 | 3.4 | 2.0 |
| Intermediate Goods | 0.1 | 1.7 | 0.6 | 5.8 | -8.4 | 10.3 | 4.0 |
| Less Food & Energy | 0.9 | 0.5 | 0.5 | 2.8 | -4.2 | 7.4 | 2.8 |
| Crude Goods | -3.5 | 9.6 | 0.8 | 28.6 | -30.4 | 21.4 | 11.9 |
| Less Food & Energy | -0.6 | 6.6 | 4.5 | 34.9 | -23.5 | 14.8 | 15.6 |
by Robert Brusca March 17, 2010
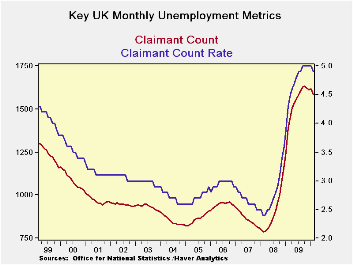
The UK, an economy that has been as much of an enigma as any, surprised us with a drop in the claimant count for February. Jobless claims fell in number by 32K in February and their numbers are lower on balance over three-months and six months. Over the past 12-monhts claims are up by nearly 200K. But as the table shows the recent months mark some progress.
The rate of unemployment on this measure that dipped to 4.9% in February and is back to where it was some 12-months ago.
The Bank of England continues to deal with an inflation overshoot of its ceiling, and the economy continues to produce statistics that vary between giving us hope and leaving us with despair. But the claimant report for February is a clear bit of good news for an economy in need of some. With Europe and the EMU wracked by problems centering on Greece and other indebted countries and the UK being drawn into that discussion there is nothing like a bit good news on the labor markets to put the skeptics back in their place.
| UK Claimant Count | ||||||
|---|---|---|---|---|---|---|
| Feb-10 | Jan-10 | Dec-09 | 3mo | 6-mo | 12-mo | |
| Level in Month | Avg in Period | |||||
| U-rate | 4.9 | 5.0 | 5.0 | 5.0 | 5.0 | 4.9 |
| Change in MO | Change over period | |||||
| Change on 000s | -32.3 | 5.3 | -9.6 | -36.6 | -20.9 | 194.7 |
by Tom Moeller March 17, 2010
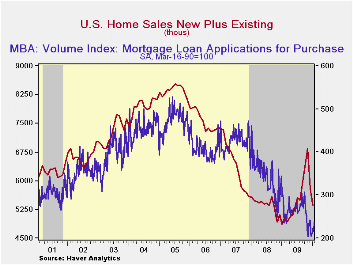
The Mortgage Bankers Association reported that mortgage applications regained their footing during the last three weeks. Despite a 1.9% decline last week, applications in March are 4.8% higher than in February when they rose 10.8% from January. Applications so far this month are at their highest level since October of last year.
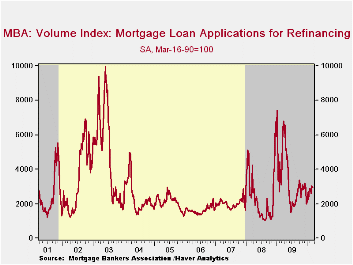
The gain likely has been fueled by an $8,000 Federal tax credit which is due to expire April 30. For last week, applications to purchase a home fell 2.3% but they were 6.2% higher than in February. During the last ten years there has been a 51% correlation between the y/y change in purchase applications and the change in new plus existing single family home sales. The correlation has lessened recently. For mortgage refinancings applications fell by roughly 1.5% for the second week but they still were at their highest in March since last August due to low interest rates.
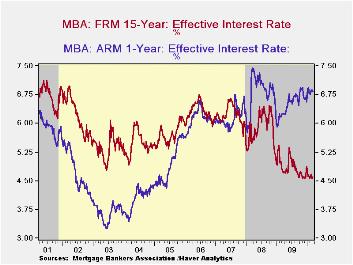
The effective fixed interest rate on conventional 15-year mortgages fell slightly to 4.60%. For the month, overall rates have been near the six year low. For 30-year mortgages the rate also slipped to 5.17%. Rates reached a high of 5.79% in early-June. Interest rates on fixed 15-year and 30-year mortgages are closely correlated (near-90%) with the rate on 10-year Treasury securities. Rates on adjustable one-year mortgages rose slightly to 6.83% last week.
The Mortgage Bankers Association surveys between 20 to 35 of the top lenders in the U.S. housing industry to derive its refinance, purchase and market indexes. The weekly survey covers roughly 50% of all U.S. residential mortgage applications processed each week by mortgage banks, commercial banks and thrifts. Visit the Mortgage Bankers Association site here.The figures for weekly mortgage applications are available in Haver's SURVEYW database.
Today's testimony by Fed Chairman Bed S. Bernanke, The Federal Reserve's role in bank supervision, can be found here.
| MBA Mortgage Applications (SA, 3/16/90=100) | 03/12/10 | 03/05/10 | 02/26/10 | Y/Y | 2009 | 2008 | 2007 |
|---|---|---|---|---|---|---|---|
| Total Market Index | 620.9 | 633.1 | 629.9 | -29.2% | 736.4 | 642.9 | 652.6 |
| Purchase | 221.5 | 226.8 | 214.5 | -13.8 | 263.5 | 345.4 | 424.9 |
| Refinancing | 2,955.9 | 3,007.2 | 3,054.3 | -34.3 | 3,509.2 | 2,394.1 | 1,997.9 |
| 15-Year Mortgage Effective Interest Rate (%) | 4.60 | 4.54 | 4.61 | 4.77 (03/09) | 4.85 | 5.9 | 6.2 |

Tom Moeller
AuthorMore in Author Profile »Prior to joining Haver Analytics in 2000, Mr. Moeller worked as the Economist at Chancellor Capital Management from 1985 to 1999. There, he developed comprehensive economic forecasts and interpreted economic data for equity and fixed income portfolio managers. Also at Chancellor, Mr. Moeller worked as an equity analyst and was responsible for researching and rating companies in the economically sensitive automobile and housing industries for investment in Chancellor’s equity portfolio. Prior to joining Chancellor, Mr. Moeller was an Economist at Citibank from 1979 to 1984. He also analyzed pricing behavior in the metals industry for the Council on Wage and Price Stability in Washington, D.C. In 1999, Mr. Moeller received the award for most accurate forecast from the Forecasters' Club of New York. From 1990 to 1992 he was President of the New York Association for Business Economists. Mr. Moeller earned an M.B.A. in Finance from Fordham University, where he graduated in 1987. He holds a Bachelor of Arts in Economics from George Washington University.
More Economy in Brief


