 Global| Jun 16 2009
U.S. PPI Decline Yr-to-Yr Matches '49 Record; Core Pricing Power Evaporates
by:Tom Moeller
|in:Economy in Brief
Summary
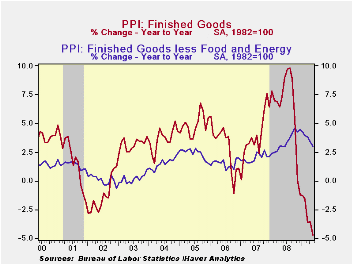
Economic recession along with lower energy prices combined last month to lower U.S. producer price inflation to its lowest since 1949. The fact that the May PPI for finished goods rose 0.2% after a +0.3% in April was not the big news. [...]
 Economic
recession along with lower energy prices combined last month to lower
U.S. producer price inflation to its lowest since 1949. The fact that
the May PPI for finished goods rose 0.2% after a +0.3% in April was not
the big news. These paltry gains followed a sharp 1.2% March downdraft
which helped pull to the year-to-year change to a negative 4.7% last
month, its weakest since 1949. The May rise compared with Consensus
expectations for a 0.6% increase. Weakness in the overall PPI reflected
a continued absence of core pricing power. The PPI less food &
energy fell 0.1% during May and prices have been flat during the last
three months.
Economic
recession along with lower energy prices combined last month to lower
U.S. producer price inflation to its lowest since 1949. The fact that
the May PPI for finished goods rose 0.2% after a +0.3% in April was not
the big news. These paltry gains followed a sharp 1.2% March downdraft
which helped pull to the year-to-year change to a negative 4.7% last
month, its weakest since 1949. The May rise compared with Consensus
expectations for a 0.6% increase. Weakness in the overall PPI reflected
a continued absence of core pricing power. The PPI less food &
energy fell 0.1% during May and prices have been flat during the last
three months.
The weakness was led by a 0.1% decline in
prices of core finished consumer goods which pulled the y/y gain down
to 3.5%, its weakest gain in a year. And more deceleration is in store
given that the three-month change in prices amounted to just 0.3% (AR).
Durable consumer goods prices were unchanged last month (2.6% y/y) and
the three-month change dropped to 1.1%. Prices of core nondurable goods
fell just slightly and that was enough to lower the three month change
to 1.3%. 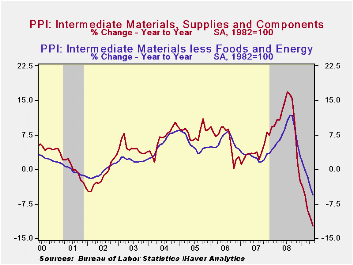 Finally, capital equipment prices fell for the third straight
month. The 0.1% slip was enough to pull the three-month change to a
negative 1.5% following the roughly 5% rates of increase last fall.
Finally, capital equipment prices fell for the third straight
month. The 0.1% slip was enough to pull the three-month change to a
negative 1.5% following the roughly 5% rates of increase last fall.
Last month's weakness in overall producer prices came despite a 2.9% increase in energy prices which nevertheless left costs down by 26.8% y/y. Finished gasoline prices rose 13.9% but that still left them nearly one-half lower than last May. Conversely, natural gas prices dropped hard for the tenth straight month. The 4.7% m/m decline pulled prices down by one-quarter versus last May. Finished food prices also were weak as they reversed all of their earlier gain with a 1.6% decline (-2.0% y/y). Indeed, versus last year the decline in food prices compares to a 9.1% rate of increase as recently as this past fall.
Continuing weak were prices for intermediate goods and that
should foreshadow further weakness in finished goods prices.
Intermediate goods prices made up just part of the April decline with a
0.3% increase. That left prices down a record 12.3% y/y. Excluding food
& energy prices were down for the eighth straight month. The
5.6% y/y decline was by far a record.
energy prices were down for the eighth straight month. The
5.6% y/y decline was by far a record.
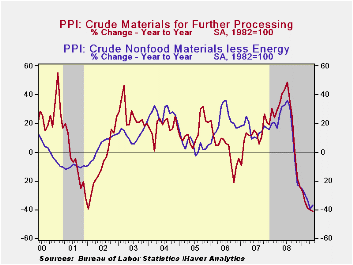
The crude materials PPI rose for a second month led by higher energy prices, up 5.3%. Despite this increase, however, crude energy prices remained down by more than one-half from the year ago level. Finished food prices rose 0.4% but that gain still left them down by 18.8% from last year. Core pricing power at the crude level bucked the trend toward weakness last month and prices rose 6.7%. That was, however, only the second increase since July and therefore prices remained down by more than one-third versus last year due to significantly lower metals and natural gas prices.
The Producer Price Index data is available in Haver's USECON database. More detailed data is in the PPI and in the PPIR databases.
Containing the Crisis and Promoting Economic Recovery is yesterday's speech by Fed Governor Elizabeth A. Duke and it can be found here.
| Producer Price Index (%) | May | April | Y/Y | 2008 | 2007 | 2006 |
|---|---|---|---|---|---|---|
| Finished Goods | 0.2 | 0.3 | -4.7 | 6.4 | 3.9 | 2.9 |
| Core | -0.1 | 0.1 | 3.0 | 3.4 | 2.0 | 1.5 |
| Intermediate Goods | 0.3 | -0.5 | -12.3 | 10.5 | 4.0 | 6.4 |
| Core | -0.2 | -0.9 | -5.6 | 7.4 | 2.8 | 6.0 |
| Crude Goods | 3.6 | 3.0 | -41.3 | 21.4 | 11.9 | 1.4 |
| Core | 6.7 | -0.6 | -36.7 | 14.8 | 15.6 | 20.8 |

Tom Moeller
AuthorMore in Author Profile »Prior to joining Haver Analytics in 2000, Mr. Moeller worked as the Economist at Chancellor Capital Management from 1985 to 1999. There, he developed comprehensive economic forecasts and interpreted economic data for equity and fixed income portfolio managers. Also at Chancellor, Mr. Moeller worked as an equity analyst and was responsible for researching and rating companies in the economically sensitive automobile and housing industries for investment in Chancellor’s equity portfolio. Prior to joining Chancellor, Mr. Moeller was an Economist at Citibank from 1979 to 1984. He also analyzed pricing behavior in the metals industry for the Council on Wage and Price Stability in Washington, D.C. In 1999, Mr. Moeller received the award for most accurate forecast from the Forecasters' Club of New York. From 1990 to 1992 he was President of the New York Association for Business Economists. Mr. Moeller earned an M.B.A. in Finance from Fordham University, where he graduated in 1987. He holds a Bachelor of Arts in Economics from George Washington University.
More Economy in Brief


