 Global| Jun 16 2009
U.S. PPI Decline Yr-to-Yr Matches'49 Record; Core Pricing Power Evaporates
by:Tom Moeller
|in:Economy in Brief
Summary
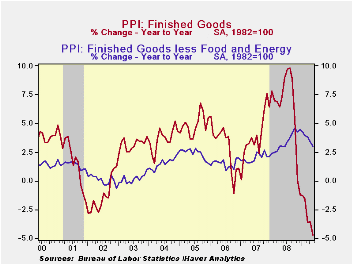
Economic recession along with lower energy prices combined last month to lower U.S. producer price inflation to its lowest since 1949. The fact that the May PPI for finished goods rose 0.2% after a +0.3% in April was not the big news. [...]
 Economic
recession along with lower energy prices combined last month to lower
U.S. producer price inflation to its lowest since 1949. The fact that
the May PPI for finished goods rose 0.2% after a +0.3% in April was not
the big news. These paltry gains followed a sharp 1.2% March downdraft
which helped pull to the year-to-year change to a negative 4.7% last
month, its weakest since 1949. The May rise compared with Consensus
expectations for a 0.6% increase. Weakness in the overall PPI reflected
a continued absence of core pricing power. The PPI less food &
energy fell 0.1% during May and prices have been flat during the last
three months.
Economic
recession along with lower energy prices combined last month to lower
U.S. producer price inflation to its lowest since 1949. The fact that
the May PPI for finished goods rose 0.2% after a +0.3% in April was not
the big news. These paltry gains followed a sharp 1.2% March downdraft
which helped pull to the year-to-year change to a negative 4.7% last
month, its weakest since 1949. The May rise compared with Consensus
expectations for a 0.6% increase. Weakness in the overall PPI reflected
a continued absence of core pricing power. The PPI less food &
energy fell 0.1% during May and prices have been flat during the last
three months.
The weakness was led by a 0.1% decline in
prices of core finished consumer goods which pulled the y/y gain down
to 3.5%, its weakest gain in a year. And more deceleration is in store
given that the three-month change in prices amounted to just 0.3% (AR).
Durable consumer goods prices were unchanged last month (2.6% y/y) and
the three-month change dropped to 1.1%. Prices of core nondurable goods
fell just slightly and that was enough to lower the three month change
to 1.3%. 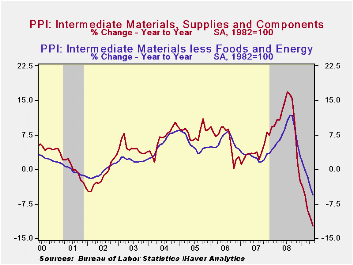 Finally, capital equipment prices fell for the third straight
month. The 0.1% slip was enough to pull the three-month change to a
negative 1.5% following the roughly 5% rates of increase last fall.
Finally, capital equipment prices fell for the third straight
month. The 0.1% slip was enough to pull the three-month change to a
negative 1.5% following the roughly 5% rates of increase last fall.
Last month's weakness in overall producer prices came despite a 2.9% increase in energy prices which nevertheless left costs down by 26.8% y/y. Finished gasoline prices rose 13.9% but that still left them nearly one-half lower than last May. Conversely, natural gas prices dropped hard for the tenth straight month. The 4.7% m/m decline pulled prices down by one-quarter versus last May. Finished food prices also were weak as they reversed all of their earlier gain with a 1.6% decline (-2.0% y/y). Indeed, versus last year the decline in food prices compares to a 9.1% rate of increase as recently as this past fall.
Continuing weak were prices for intermediate goods and that
should foreshadow further weakness in finished goods prices.
Intermediate goods prices made up just part of the April decline with a
0.3% increase. That left prices down a record 12.3% y/y. Excluding food
& energy prices were down for the eighth straight month. The
5.6% y/y decline was by far a record.
energy prices were down for the eighth straight month. The
5.6% y/y decline was by far a record.
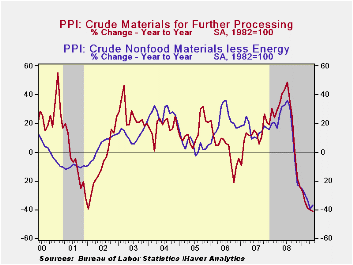
The crude materials PPI rose for a second month led by higher energy prices, up 5.3%. Despite this increase, however, crude energy prices remained down by more than one-half from the year ago level. Finished food prices rose 0.4% but that gain still left them down by 18.8% from last year. Core pricing power at the crude level bucked the trend toward weakness last month and prices rose 6.7%. That was, however, only the second increase since July and therefore prices remained down by more than one-third versus last year due to significantly lower metals and natural gas prices.
The Producer Price Index data is available in Haver's USECON database. More detailed data is in the PPI and in the PPIR databases.
Containing the Crisis and Promoting Economic Recovery is yesterday's speech by Fed Governor Elizabeth A. Duke and it can be found here.
| Producer Price Index (%) | May | April | Y/Y | 2008 | 2007 | 2006 |
|---|---|---|---|---|---|---|
| Finished Goods | 0.2 | 0.3 | -4.7 | 6.4 | 3.9 | 2.9 |
| Core | -0.1 | 0.1 | 3.0 | 3.4 | 2.0 | 1.5 |
| Intermediate Goods | 0.3 | -0.5 | -12.3 | 10.5 | 4.0 | 6.4 |
| Core | -0.2 | -0.9 | -5.6 | 7.4 | 2.8 | 6.0 |
| Crude Goods | 3.6 | 3.0 | -41.3 | 21.4 | 11.9 | 1.4 |
| Core | 6.7 | -0.6 | -36.7 | 14.8 | 15.6 | 20.8 |
by Tom Moeller June 16, 2009
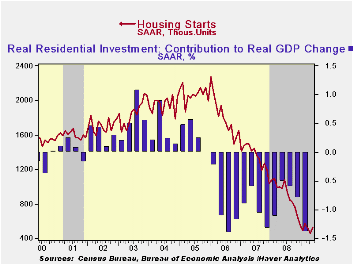
Though housing starts posted a gain last month, the rise was modest and it suggests that the U.S. housing sector remains under pressure. Total housing starts recovered from their April decline with a 17.2% m/m rise to 532,000 (AR) units. The May figure was firmer than Consensus expectations for 485,000 starts. However, despite the surprise starts remained down by nearly one-half from one year ago. The best that can be noted is that a further decline has not occurred and starts have been flat during 2009.
Starts of single-family homes posted their third consecutive monthly increase. Regardless, single-family starts remained near the record low for the series which dates back to 1959 and the latest level was down three-quarters since the peak in early-2006. During the last ten years, there has been an 84% correlation between the q/q change in single-family starts and their contribution to quarterly GDP growth.
Starts of multi-family homes rose by nearly two-thirds m/m to
131,000. Nevertheless, the increase failed to make up an April decline
and starts of apartments, condominiums & town houses remained
down by nearly half from May of last year and starts were off
two-thirds from the 2006 peak.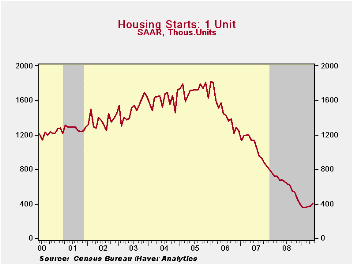
By region, starts of single-family units last month showed broad-based gains. Single-family starts in the Midwest rose 9.4% to their highest level since November (-38.1% y/y). In the South, single-family starts made up the decline of the previous two months with a 10.6% increase off the record low (-42.4% y/y). In the West starts rose for the third straight month (-36.2% y/y). Countering these monthly increases was another decline in the Northeast which was the second in a row (-47.8% y/y).
The latest level of building permits remained near the record low last month. The 4.0% increase did not make up for declines during the prior two months and, overall, permits were down by roughly one-half from last May. Single-family home permits, a leading indicator of starts, however, ticked up 3.6% from March (-42.3% y/y).
The housing starts figures can be found in Haver's USECON database.
| Housing Starts (000s, SAAR) | May | April | Y/Y | 2008 | 2007 | 2006 |
|---|---|---|---|---|---|---|
| Total | 532 | 454 | -45.2% | 900 | 1,342 | 1,812 |
| Single-Family | 401 | 373 | -40.9 | 616 | 1,036 | 1,474 |
| Multi-Family | 131 | 81 | -55.1 | 285 | 306 | 338 |
| Building Permits | 518 | 498 | -47.0 | 895 | 1,392 | 1,844 |
by Tom Moeller June 16, 2009
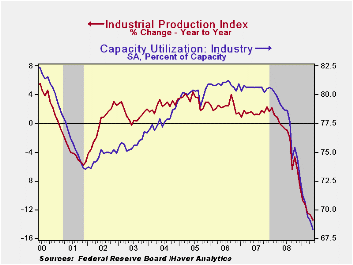
The Federal Reserve reported that the earlier letup in the factory sector recession was short-lived. Output, which includes mining and utilities, declined a greater-than-expected 1.1% last month following a 0.7% April drop that was larger than reported initially. During the last three months, output is off at a 13.7% rate, and off 13.5% in the last twelve, the sharpest drop y/y since 1946.
Output of consumer goods overall fell 0.9% (-7.2% y/y) and the
declines were broad-based. Production of autos fell another 5.3%,
though the year-to-year decline eased to -29.0%. Furniture, appliance
& carpeting output continued to reflect the weakness in the
housing market and posted a 1.1% drop (-20.8% y/y) while apparel output
slipped 0.3% (-10.6% y/y). In the capital goods sector, there's been no
letup in output's rate of decline. Production of business equipment
fell 1.4% last month and the three-month rate of change stands at
-21.5% (AR), nearly the worst of this downturn. Finally, the downturn
in the housing market continued to exact its toll on the output off
construction supplies. It fell 1.0% and at a 19.2 rate during the last
three months.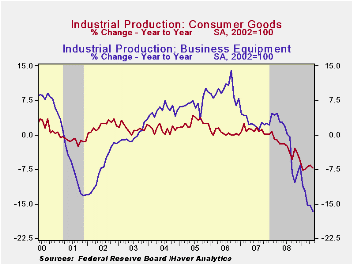
The high-tech sector continued to suffer. Industrial production here fell 1.9% last month but at a reduced 5.5% rate during the last three. Less high tech, overall industrial production fell 0.8% last month and the annual rate of change eased to -13.6%.
Excess capacity grew even further last month. Capacity utilization fell to 68.3%, a record low for the series which dates to 1966. Utilization in the factory sector dropped even harder to 65.0% from a peak near 80% back in 2007. The latest, again, was the lowest since WWII.
The industrial production data are available in Haver's USECON database.
| INDUSTRIAL PRODUCTION (SA, %) | May | April | Y/Y | 2008 | 2007 | 2006 |
|---|---|---|---|---|---|---|
| Total Output | -1.1 | -0.7 | -13.5 | -2.2 | 1.5 | 2.3 |
| Manufacturing | -1.0 | -0.6 | -15.3 | -3.2 | 1.4 | 2.5 |
| Consumer Goods | -0.9 | -0.2 | -7.2 | -2.6 | 0.9 | 0.4 |
| Business Equipment | -1.4 | -1.9 | -16.5 | -1.1 | 2.7 | 9.4 |
| Construction Supplies | -1.0 | -1.6 | -21.5 | -6.3 | -2.0 | 2.3 |
| Utilities | -1.4 | 0.7 | -3.4 | 0.3 | 3.4 | -0.6 |
| Capacity Utilization | 68.3 | 69.0 | 78.9 (May '08) | 77.6 | 80.6 | 80.9 |
by Louise Curley June 16, 2009
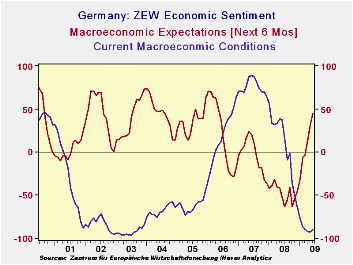
Optimists regarding the outlook for the next six months among
German financial market professionals outweighed pessimists by 44.8% in
June according to the latest ZEW Survey (The Mannheim based Center for
European Economic Research). This represented an increase of 13.7
percentage points from May and was the largest margin of optimists
since June 2006. It was also well above the long term average of 26.3%.
The financial professionals also saw some slight improvement in current
conditions. The percent balance between pessimists and optimists
declined from 92.9%in May to 89.7% in June. The first chart shows the
ZEW appraisals of current conditions and expectation for the next six
months.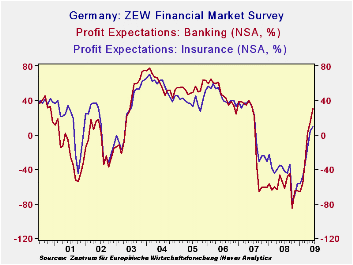
A part of the group's more optimistic appraisal of the outlook can be attributed to their expectations of profit increases in both the banking and insurance industries, as shown in the second chart. Expectations of profits in the banking industry have risen from 2.0% in April to 30.8% in June, and in the insurance industry from 5.1% in May to 9.7% in June. Except for a 5.4% increase in Utilities' profits and virtually no change in Information Technology profits, expectations for all the other industry are still negative, although less so.
| ZEW SURVEY | Jun 09 | May 09 | Apr 09 | Mar 09 | Feb 09 | Jan 09 | Jun 06 | |
|---|---|---|---|---|---|---|---|---|
| Expectation Next 6 Months (% bal) | 44.8 | 31.1 | 13.0 | -3.5 | -5.8 | -31.0 | 37.8 | |
| Current Conditions (% bal) | -89.7 | -92.8 | -91.6 | -89.4 | -86.2 | -77.1 | 11.9 | |
| Profit Expectations Next 6 Months (%) | ||||||||
| Banking | 30.8 | 15.1 | 2.0 | -31.6 | -55.7 | -65.7 | 46.5 | |
| Insurance | 9.7 | 5.1 | -15.1 | -34.2 | -49.0 | -56.5 | 46.3 |
by Tom Moeller June 16, 2009
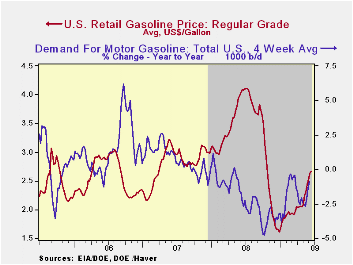
Speculation that the U.S. economic recovery is taking hold drove regular gasoline prices even higher last week to an average $2.67 per gallon of regular. Gasoline prices now have risen more than $1.00 per gallon, or by more than one-half, from the December low to the highest level since late-October. Yesterday, the cash market price for a gallon of regular gas rose further to $2.02 per gallon versus $1.96 averaged last week. These also were the highest prices since last October. The figures are reported by the U.S. Department of Energy and can be found in Haver's WEEKLY & DAILY databases.
Evidence that the economic rebound is finally taking hold may be evidenced in the figures for vehicle-miles driven. The year-to-year change in miles driven still is negative, but the y/y change of -0.7% is the least since March and is well improved from the -5% comparisons of this past fall. The change in demand is measured using the latest four weeks versus the same four weeks in 2008. Demand for all petroleum products was down 6.9% y/y in the latest week led by a 19.7% drop in demand for residual fuel oil and a 12.8% drop in distillate demand. These numbers are available in Haver's OILWKLY database.
Higher crude oil prices are behind the rise in gasoline costs. Crude prices averaged $70.83 last week for a barrel of West Texas Intermediate, up from the December low of $32.37 per barrel. Yesterday, crude oil prices held steady at $70.62 and prices reached a high of $145.66 last July. The latest price increases occurred despite a 3.9% year-to-year rise in crude oil production during the latest four weeks. Further more, they have occurred despite a 13.7% y/y rise in inventories of crude oil & petroleum products. The figures on crude oil production and inventories are available in Haver's OILWKLY database.
Finally, the gains in the price of natural gas paused again last week and it fell back to $3.56 per mmbtu (-71.8% y/y). The latest price was nearly the lowest since 2002 and is down by two-thirds from the high reached in early-July of $13.19/mmbtu.
Economic and Environmental Impacts of U.S. Corn Ethanol Production and Use from the Federal Reserve Bank of St. Louis is available here.
| Weekly Prices | 06/15/09 | 06/08/09 | Y/Y | 2008 | 2007 | 2006 |
|---|---|---|---|---|---|---|
| Retail Regular Gasoline ($ per Gallon, Regular) | 2.67 | 2.62 | -34.5% | 3.25 | 2.80 | 2.57 |
| Light Sweet Crude Oil, WTI ($ per bbl.) | 70.83 | 68.10 | -47.4% | 100.16 | 72.25 | 66.12 |

Tom Moeller
AuthorMore in Author Profile »Prior to joining Haver Analytics in 2000, Mr. Moeller worked as the Economist at Chancellor Capital Management from 1985 to 1999. There, he developed comprehensive economic forecasts and interpreted economic data for equity and fixed income portfolio managers. Also at Chancellor, Mr. Moeller worked as an equity analyst and was responsible for researching and rating companies in the economically sensitive automobile and housing industries for investment in Chancellor’s equity portfolio. Prior to joining Chancellor, Mr. Moeller was an Economist at Citibank from 1979 to 1984. He also analyzed pricing behavior in the metals industry for the Council on Wage and Price Stability in Washington, D.C. In 1999, Mr. Moeller received the award for most accurate forecast from the Forecasters' Club of New York. From 1990 to 1992 he was President of the New York Association for Business Economists. Mr. Moeller earned an M.B.A. in Finance from Fordham University, where he graduated in 1987. He holds a Bachelor of Arts in Economics from George Washington University.
More Economy in Brief


