 Global| Nov 01 2007
U.S. Personal Spending Up 0.3%, Income Rose 0.4%
by:Tom Moeller
|in:Economy in Brief
Summary
Personal consumption expenditures rose 0.3% in September, below the downwardly revised 0.5% August increase and below expectations for a 0.4% rise. A pattern of steadily declining rates of increase prevailed through 2007; 1Q up 7.3% [...]
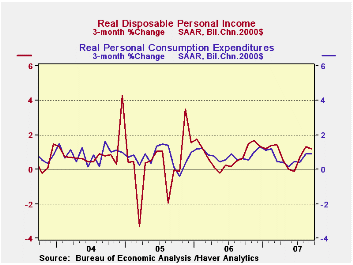
Personal consumption expenditures rose 0.3% in September, below the downwardly revised 0.5% August increase and below expectations for a 0.4% rise. A pattern of steadily declining rates of increase prevailed through 2007; 1Q up 7.3% (AR), 2Q up 5.7%, 3Q 4.7%.
Most of that slowdown, however, reflects easier price gains. Adjusted for inflation, consumption rose 3.0% last quarter following a 1.4% 2Q gain and a 3.7% 1Q increase. For the year as a whole 2007 real personal consumption should turn in a 3.1% rise, the same as during 2006.
For September, the slower real increase of 0.1% versus a 0.6% August jump reflected a much easier 0.7% rise in auto sales. In the nondurable area spending on tobacco and clothing dropped. In the services area spending on recreation and electricity & gas consumption fell. These (perhaps too) fine levels of detail are available in Haver's USNA database.
Personal income rose 0.4% in September, the same as during an upwardly revised August, in line with Consensus forecasts.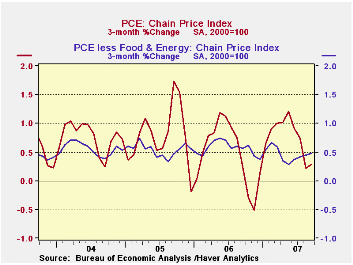
Wages & salaries rose 0.6% (7.1% y/y), ahead of the upwardly revised 0.4% August increase. Factory sector wages were unchanged (6.2% y/y), about as they had been m/m during all of 3Q.Wage & salary income in the service-producing industries recovered 0.8% (8.1% y/y) and wages in the government sector rose 0.4% (4.4% y/y).
Interest income grew 0.5% (4.7% y/y), stronger with the rise in interest rates, and dividend income popped another 0.9% (13.3% y/y).
Personal current taxes rose 0.5% (10.3% y/y). As a result, disposable personal income grew 0.4% (6.3% y/y). Adjusted for inflation, disposable personal income rose 0.2% (3.9% y/y) after a 0.5% August increase.
The PCE chain price index 0.2% (2.4% y/y). The core PCE price index was a bit firmer than in August with a 0.2% rise. The overall price index should firm with oil prices moving above $90 per barrel.
Can Social Security Survive the Baby Boomers? from the Federal reserve Bank of St. Louis can be found here.
The text which accompanied yesterday's FOMC decision to cut interest rates can be found here.
| Disposition of Personal Income | September | August | Y/Y | 2006 | 2005 | 2004 |
|---|---|---|---|---|---|---|
| Personal Income | 0.4% | 0.4% | 6.8% | 6.6% | 5.9% | 6.2% |
| Personal Consumption | 0.3% | 0.5% | 5.6% | 5.9% | 6.2% | 6.4% |
| Saving Rate | 0.9% | 0.8% | 0.4% (Sept. 06) | 0.4% | 0.5% | 2.1% |
| PCE Chain Price Index | 0.2% | -0.0% | 2.4% | 2.8% | 2.9% | 2.6% |
| Less food & energy | 0.2% | 0.1% | 1.8% | 2.2% | 2.2% | 2.1% |
by Tom Moeller November 1, 2007
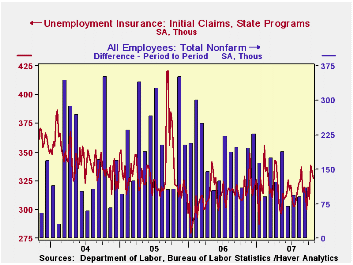
Initial claims for unemployment insurance fell slightly last week but it was only to 327,000 from an upwardly revised 333,000 during the prior week. There were no distortions to the figure from holidays.
The four week moving average of initial claims rose again to 327,000 (4.1% y/y).
A claims level below 400,000 typically has been associated with growth in nonfarm payrolls. During the last six years there has been a (negative) 78% correlation between the level of initial claims and the m/m change in nonfarm payroll employment.
Continuing claims for unemployment insurance rose a sharp 2.6%. The increase during the prior week was downwardly revised slightly.
The continuing claims numbers lag the initial claims figures by one week.
The insured rate of unemployment rose to 2.0%. from 1.9% the week prior.
| Unemployment Insurance (000s) | 10/27/07 | 10/20/07 | Y/Y | 2006 | 2005 | 2004 |
|---|---|---|---|---|---|---|
| Initial Claims | 327 | 333 | -0.6% | 313 | 331 | 343 |
by Tom Moeller November 1, 2007
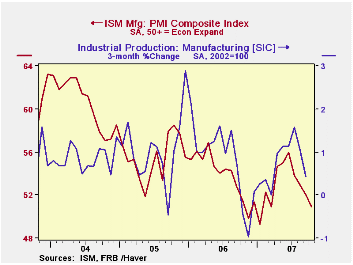
The Composite Index of activity in the manufacturing sector, reported by the Institute of Supply Management (ISM), fell to 50.9 last month from 52.0 during September. A reading above 50 indicates growth in factory sector activity. Consensus expectations had been for a reading of 51.6.
Last month's PMI figure was the lowest since January when industrial production in the factory sector fell 0.6%. The three month % change in factory sector output fell to 0.4% last month
During the last twenty years there has been a 64% correlation between the level of the Composite Index and the three month growth in factory sector industrial production.
It is appropriate to correlate the ISM index level with factory sector growth because the ISM index is a diffusion index. It measures growth by being constructed using all of the absolute positive changes in activity added to one half of the no change in activity measures.
Declines in three of the index's five components accounted for the lower composite index, notable was the decline in the production component. The inventories component rose sharply to its highest level since July and employment also rose.
The modest 0.3 point rise in the employment index to 52.0 followed a 0.4 point September rise. During the last twenty years there has been a 67% correlation between the level of the ISM employment Index and the three month growth in factory sector employment.
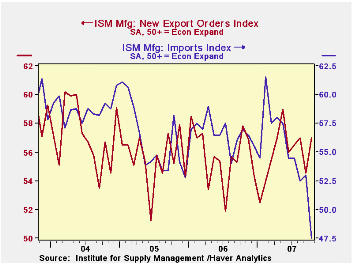
The index of new export orders recovered all of its September decline with a 2.5 point rise to 57.0. The import index conversely fell to 47.5, the lowest level since 2001 and suggestive that imports declined last month.
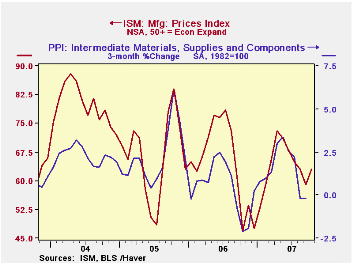
The prices index moved much higher with the rise in oil
prices. During the last twenty years there has been a 77% correlation
between the price index and the three month change in the PPI for
intermediate goods.
| October | September | October'06 | 2006 | 2005 | 2004 | |
|---|---|---|---|---|---|---|
| Composite Index | 50.9 | 52.0 | 51.5 | 53.9 | 55.5 | 60.5 |
| New Orders Index | 52.5 | 53.4 | 52.1 | 55.4 | 57.4 | 63.5 |
| Prices Paid Index (NSA) | 63.0 | 59.0 | 47.0 | 65.0 | 66.4 | 79.8 |
by Robert Brusca November 1, 2007
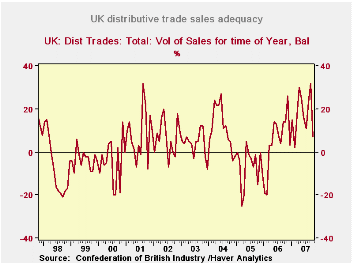
The UK distributive trades survey shows a slowing of the UK economy. Sales are at a +13 from a year ago and at +7 for this time of year (Chart). Each of those figures is about at the midpoint of their respective ranges. Orders at -1 stand in the bottom third of their range. This is a slowdown in progress. The outlook is however more upbeat. Sales are expected to post a +28 next month and that expectation is a top 16% of range expectation. The graph on the left shows the recent volatility in sales. For the moment it appears as though industry respondents are not taking the slowdown very seriously. The other outlook measures at the bottom of the table are strong to firm in their respective ranges as well.
| UK Distributive volume data CBI Survey | |||||||||
|---|---|---|---|---|---|---|---|---|---|
| Reported: | Oct-07 | Sep-07 | Aug-07 | Jul-07 | 12MO Avg | %tile | Max | Min | Range |
| Sales/Yr Ago | 13 | 40 | 30 | 4 | 21 | 49% | 49 | -21 | 70 |
| Orders/Yr Ago | -1 | 38 | 18 | 1 | 16 | 31% | 42 | -20 | 62 |
| Sales: Time/Yr | 7 | 32 | 23 | 11 | 17 | 56% | 32 | -25 | 57 |
| Stocks: Sales | 5 | 10 | 19 | 12 | 10 | 22% | 30 | -2 | 32 |
| Expected: | |||||||||
| Sales/Yr Ago | 28 | 33 | 0 | 19 | 20 | 84% | 36 | -15 | 51 |
| Orders/Yr Ago | 26 | 23 | -4 | 16 | 16 | 89% | 32 | -24 | 56 |
| Sales: Time/Yr | 12 | 28 | 8 | 13 | 15 | 61% | 29 | -15 | 44 |
| Stocks: Sales | 7 | 15 | 8 | 8 | 8 | 53% | 22 | -10 | 32 |
by Robert Brusca November 1, 2007
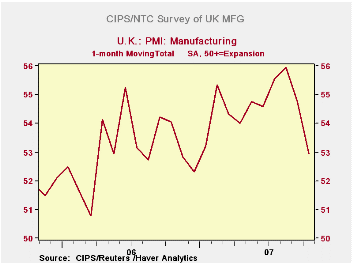
The CIPS/NTC index of MFG for the UK shows a rather rapid downturn is in play. But the index reading at 52.9 is still reasonably upbeat by the historic standards of this survey. While the index is down from a peak of about 56 in August that nearly matches past peaks of around 56 back in 2004, the current reading is still in the 58th percentile of its range - a firm reading and solid location. Still, the table shows that the index has been falling and is now down over 6 months and 12 months even though the fall is rather recent. The depth of the plunge is notable. The two-month 3.03 point drop is the largest change in the index since it rose by 3.03 points in January of this year. We have to go back to May of 2005 to find a larger two-month drop. So despite the reasonably cozy position of the index in its range we should be on the outlook for more weakness given the speed of this drop.
| MFG PMI CIPS/NTC | |||||||
|---|---|---|---|---|---|---|---|
| Monthly readings | Change over: | percentile | |||||
| Oct-07 | Sep-07 | Aug-07 | 3MO | 6MO | 12MO | of range | |
| MFG | 52.93 | 54.73 | 55.96 | -2.61 | -1.07 | -1.12 | 58.4 |
| Range since January 1992 | |||||||
by Carol Stone November 1, 2007
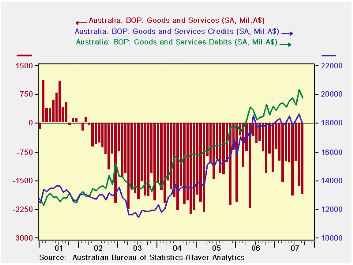 The deficit in Australia's trade in goods and
services
increased further in September as exports declined and an accompanying
decline in imports was smaller. The overall deficit was A$1,862
million, up from A$1,665 million in August (seasonally adjusted). The
year-ago figure was A$761 million.
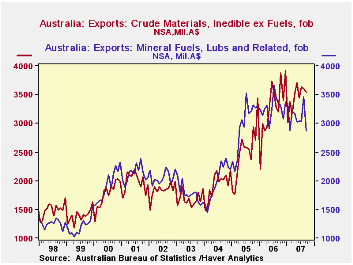
We have highlighted here before (See May 4, 2007 commentary) the role of raw materials, particularly mineral resources, in Australia's international trade. The SITC 3 categories, "crude materials, inedible, ex fuels" and "mineral fuels, etc" together constitute about half of the nation's total goods exports. These exports have brought considerable revenue into the Australian economy. Australia's economy has been strong recently. Indeed, today, a report of September retail trade shows a gain of 0.9% in that month, extending a trend of notable growth in consumer spending.
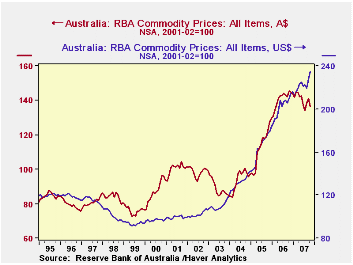
However, the commodities markets are priced in US dollars. The Australian dollar, perhaps bolstered by the vigorous economy, has risen markedly. Yesterday, according to the New York Federal Reserve Bank, it was priced at US$0.9271, the highest month-end value since March 1984. [In fact, a retail purchase in New York City yesterday came right at par.] This rapid increase in the exchange rate means that world commodities, with US dollar prices, bring relatively fewer Australian dollars than before. Thus, it is not surprising to see a moderation in the value of these key Australian exports, which have averaged over the last six months only 0.5% above a year ago.
This point is more clearly made in the commodity price index compiled by the Reserve Bank of Australia; the RBA publishes this in both US$ and A$. See the difference in the third graph. Flexible currency values are, of course, one of the important transmission mechanisms for global trade adjustment and for monetary policy. The strong Australian dollar can help restrain inflation in Australia and by slowing the Australian-dollar value of tradable goods, it can also modulate economic activity, an "automatic stabilizer". Still, today's strong retail trade report brought further talk the the RBA might raise interest rates at its next policy meeting. This talk too can bring more strength to the currency -- at least until it is evident that that very strength is restraining the economy.
| AUSTRALIA (Mil.A$) | Sept 2007 | Aug 2007 | Jul 2007 | Sept 2006 | Monthly Averages | ||
|---|---|---|---|---|---|---|---|
| 2006 | 2005 | 2004 | |||||
| Balance on Goods & Services | -1,862 | -1,665 | -1,011 | -761 | -969 | -1,399 | -1,985 |
| Goods Credits (Exports) | 13,764 | 14,558 | 14,200 | 14,009 | 13,809 | 11,690 | 9,881 |
| Goods Debits (Imports) | 15,848 | 16,408 | 15,408 | 14,908 | 14,871 | 13,147 | 11,922 |
| Balance on Services | 223 | 185 | 190 | 138 | 93 | 58 | 58 |
| Raw Material Exports* (NSA) | 6,404 | 7,077 | 6,681 | 6,556 | 6,544 | 5,475 | 3,908 |
Tom Moeller
AuthorMore in Author Profile »Prior to joining Haver Analytics in 2000, Mr. Moeller worked as the Economist at Chancellor Capital Management from 1985 to 1999. There, he developed comprehensive economic forecasts and interpreted economic data for equity and fixed income portfolio managers. Also at Chancellor, Mr. Moeller worked as an equity analyst and was responsible for researching and rating companies in the economically sensitive automobile and housing industries for investment in Chancellor’s equity portfolio. Prior to joining Chancellor, Mr. Moeller was an Economist at Citibank from 1979 to 1984. He also analyzed pricing behavior in the metals industry for the Council on Wage and Price Stability in Washington, D.C. In 1999, Mr. Moeller received the award for most accurate forecast from the Forecasters' Club of New York. From 1990 to 1992 he was President of the New York Association for Business Economists. Mr. Moeller earned an M.B.A. in Finance from Fordham University, where he graduated in 1987. He holds a Bachelor of Arts in Economics from George Washington University.
More Economy in Brief
 Global| Feb 05 2026
Charts of the Week: Balanced Policy, Resilient Data and AI Narratives
by:Andrew Cates


