 Global| May 03 2010
U.S. Personal Spending & Income Firm
by:Tom Moeller
|in:Economy in Brief
Summary
U.S. consumers love to spend, even if they don't have the money. Personal consumption expenditures increased an expected 0.6% during March as spending grew faster than income for the second month in a row. During the last six months [...]
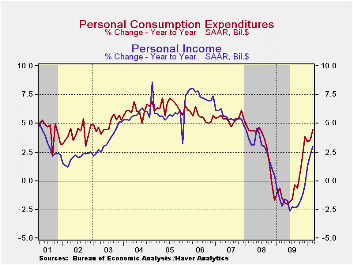
U.S. consumers love to spend, even if they don't have the money. Personal consumption expenditures increased an expected 0.6% during March as spending grew faster than income for the second month in a row. During the last six months spending increases have been between 0.3% and 0.6% as consumers have dug into their wallets to buy more costly gasoline. Though spending on gasoline slipped during the last two months, it's up by one-third during the last twelve. In constant dollars, spending on gasoline actually fell 1.3% y/y.
Leading the rise in March spending was a 9.2% increase (14.9% y/y) in spending on motor vehicles. In real terms spending rose 8.9%. Also strong was the 1.5% increase (4.9% y/y) in nominal apparel spending which followed a similar February gain; both were led by discount pricing. In real terms March spending rose 5.3% y/y. Also strong was spending on home furnishings. The 1.1% gain followed an even stronger February increase. A 4.4% y/y rise (8.9% in real terms) follows the 6.2% decline during all of last year. Spending on services continued firm at 2.9% y/y but that was bloated by a 4.6% y/y jump in health care expenditures.
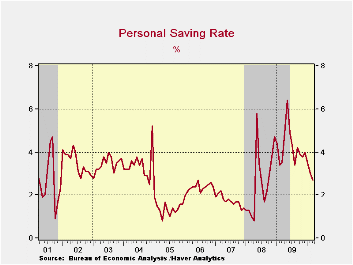
These spending gains outpaced personal income which rose an expected 0.3% after a 0.1% February increase (3.0% y/y). Help from lower taxes has now faded. March disposable income rose 0.3% (3.4% y/y) after having been unchanged during the prior month. Higher gasoline prices also cut into income growth such that the y/y gain in real disposable income amounted to only 1.4%, barely improved from last year's 0.9% increase. The combination of spending gains that outpaced income growth lowered the personal savings rate to 2.7%, its lowest since late-2008. The rate still was up, however, from the 1.0% low at the beginning of the last recession.
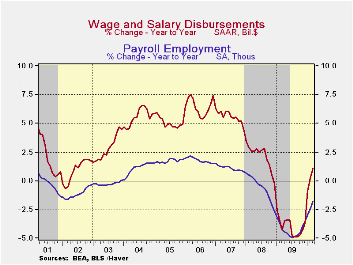
Moderate employment declines left wages & salaries up just 0.2% (1.1% y/y) after the 0.1% February uptick. Nevertheless the modest y/y gain is improved from the sharp 4.0% decline last year. Wages in the factory sector, however, were unchanged in March (-3.4% y/y) but that still contrasted well to the 11.3% shortfall last year. In the private service sector, wages increased 0.2% (2.3% y/y). Workers in the government have seen better wage growth. A 0.2% March gain pulled wages up 2.2% y/y though that was a deceleration from the 3.6% rise last year.
Improvement in the housing market pulled proprietors' income up 3.7% y/y, its strongest gain since late 2006. The stabilization of interest rates left interest income up 1.1% y/y, its best since 2008. Dividend income remained down 6.1% y/y but that compared favorably to last year's 19.3% drop and the 10.3% 2007 decline. Finally, unemployment insurance benefits rose 8.7% m/m though the one-third increase versus last year was down from its doubling last year.
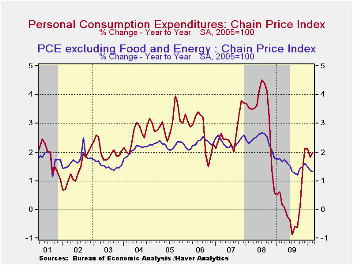
The PCE chain price index rose just 0.1% with the 1.0% slip (+35.2% y/y) in gasoline prices. The core PCE price deflator also rose just 0.1%, held back by a 0.6% decline (-0.4% y/y) in apparel prices and a 0.1% slip (-4.1% y/y) in furniture prices (-1.6% y/y). Services prices also ticked up just 0.1% (1.6% y/y) for the second month. but health care prices rose 0.2% (2.5% y/y). Offsetting some of this strength was an 11.0% y/y drop in personal computer prices.
The personal income & consumption figures are available in Haver's USECON and USNA databases.
| Disposition of Personal Income (%) | March | February | January | Y/Y | 2009 | 2008 | 2007 |
|---|---|---|---|---|---|---|---|
| Personal Income | 0.3 | 0.1 | 0.4 | 3.0 | -1.7 | 2.9 | 5.6 |
| Disposable Personal Income | 0.3 | 0.0 | -0.2 | 3.4 | 1.1 | 3.9 | 4.9 |
| Personal Consumption Expenditures | 0.6 | 0.5 | 0.3 | 4.5 | -0.4 | 3.1 | 5.4 |
| Saving Rate | 2.7 | 3.0 | 3.5 | 3.5 (Mar. '09) | 4.3 | 2.6 | 1.7 |
| PCE Chain Price Index | 0.1 | 0.0 | 0.2 | 2.0 | 0.2 | 3.3 | 2.7 |
| Less food & energy | 0.1 | 0.0 | 0.0 | 1.3 | 1.5 | 2.4 | 2.4 |

Tom Moeller
AuthorMore in Author Profile »Prior to joining Haver Analytics in 2000, Mr. Moeller worked as the Economist at Chancellor Capital Management from 1985 to 1999. There, he developed comprehensive economic forecasts and interpreted economic data for equity and fixed income portfolio managers. Also at Chancellor, Mr. Moeller worked as an equity analyst and was responsible for researching and rating companies in the economically sensitive automobile and housing industries for investment in Chancellor’s equity portfolio. Prior to joining Chancellor, Mr. Moeller was an Economist at Citibank from 1979 to 1984. He also analyzed pricing behavior in the metals industry for the Council on Wage and Price Stability in Washington, D.C. In 1999, Mr. Moeller received the award for most accurate forecast from the Forecasters' Club of New York. From 1990 to 1992 he was President of the New York Association for Business Economists. Mr. Moeller earned an M.B.A. in Finance from Fordham University, where he graduated in 1987. He holds a Bachelor of Arts in Economics from George Washington University.
More Economy in Brief


