 Global| May 03 2010
U.S. Personal Spending &Income Firm
by:Tom Moeller
|in:Economy in Brief
Summary
U.S. consumers love to spend, even if they don't have the money. Personal consumption expenditures increased an expected 0.6% during March as spending grew faster than income for the second month in a row. During the last six months [...]
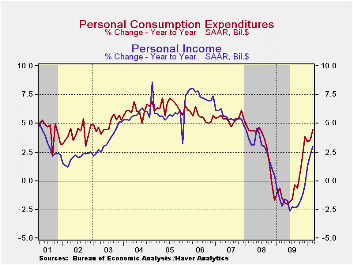
U.S. consumers love to spend, even if they don't have the money. Personal consumption expenditures increased an expected 0.6% during March as spending grew faster than income for the second month in a row. During the last six months spending increases have been between 0.3% and 0.6% as consumers have dug into their wallets to buy more costly gasoline. Though spending on gasoline slipped during the last two months, it's up by one-third during the last twelve. In constant dollars, spending on gasoline actually fell 1.3% y/y.
Leading the rise in March spending was a 9.2% increase (14.9% y/y) in spending on motor vehicles. In real terms spending rose 8.9%. Also strong was the 1.5% increase (4.9% y/y) in nominal apparel spending which followed a similar February gain; both were led by discount pricing. In real terms March spending rose 5.3% y/y. Also strong was spending on home furnishings. The 1.1% gain followed an even stronger February increase. A 4.4% y/y rise (8.9% in real terms) follows the 6.2% decline during all of last year. Spending on services continued firm at 2.9% y/y but that was bloated by a 4.6% y/y jump in health care expenditures.
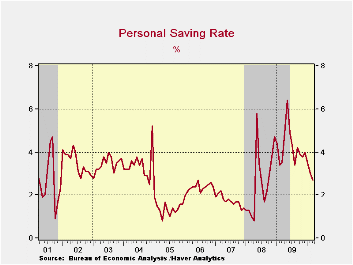
These spending gains outpaced personal income which rose an expected 0.3% after a 0.1% February increase (3.0% y/y). Help from lower taxes has now faded. March disposable income rose 0.3% (3.4% y/y) after having been unchanged during the prior month. Higher gasoline prices also cut into income growth such that the y/y gain in real disposable income amounted to only 1.4%, barely improved from last year's 0.9% increase. The combination of spending gains that outpaced income growth lowered the personal savings rate to 2.7%, its lowest since late-2008. The rate still was up, however, from the 1.0% low at the beginning of the last recession.
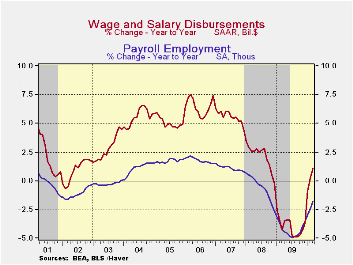
Moderate employment declines left wages & salaries up just 0.2% (1.1% y/y) after the 0.1% February uptick. Nevertheless the modest y/y gain is improved from the sharp 4.0% decline last year. Wages in the factory sector, however, were unchanged in March (-3.4% y/y) but that still contrasted well to the 11.3% shortfall last year. In the private service sector, wages increased 0.2% (2.3% y/y). Workers in the government have seen better wage growth. A 0.2% March gain pulled wages up 2.2% y/y though that was a deceleration from the 3.6% rise last year.
Improvement in the housing market pulled proprietors' income up 3.7% y/y, its strongest gain since late 2006. The stabilization of interest rates left interest income up 1.1% y/y, its best since 2008. Dividend income remained down 6.1% y/y but that compared favorably to last year's 19.3% drop and the 10.3% 2007 decline. Finally, unemployment insurance benefits rose 8.7% m/m though the one-third increase versus last year was down from its doubling last year.
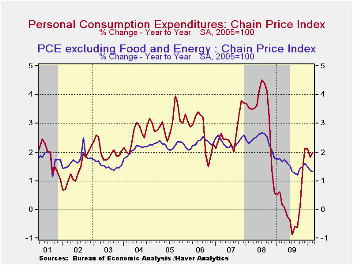
The PCE chain price index rose just 0.1% with the 1.0% slip (+35.2% y/y) in gasoline prices. The core PCE price deflator also rose just 0.1%, held back by a 0.6% decline (-0.4% y/y) in apparel prices and a 0.1% slip (-4.1% y/y) in furniture prices (-1.6% y/y). Services prices also ticked up just 0.1% (1.6% y/y) for the second month. but health care prices rose 0.2% (2.5% y/y). Offsetting some of this strength was an 11.0% y/y drop in personal computer prices.
The personal income & consumption figures are available in Haver's USECON and USNA databases.
| Disposition of Personal Income (%) | March | February | January | Y/Y | 2009 | 2008 | 2007 |
|---|---|---|---|---|---|---|---|
| Personal Income | 0.3 | 0.1 | 0.4 | 3.0 | -1.7 | 2.9 | 5.6 |
| Disposable Personal Income | 0.3 | 0.0 | -0.2 | 3.4 | 1.1 | 3.9 | 4.9 |
| Personal Consumption Expenditures | 0.6 | 0.5 | 0.3 | 4.5 | -0.4 | 3.1 | 5.4 |
| Saving Rate | 2.7 | 3.0 | 3.5 | 3.5 (Mar. '09) | 4.3 | 2.6 | 1.7 |
| PCE Chain Price Index | 0.1 | 0.0 | 0.2 | 2.0 | 0.2 | 3.3 | 2.7 |
| Less food & energy | 0.1 | 0.0 | 0.0 | 1.3 | 1.5 | 2.4 | 2.4 |
by Tom Moeller May 3, 2010
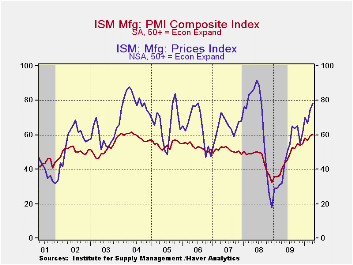
Employment growth is helping to underpin the recovery in factory sector activity. According to the Institute for Supply Management, the level of activity grew last month at the fastest pace since June of 2004. The April composite index rose to 60.4 and slightly beat Consensus expectation for a rise to 60.0. It was up from the low of 32.9 reached in December '08. (Any figure above the break-even point of 50 suggests rising activity.) The ISM data is available in Haver's USECON database.
The index for factory sector hiring activity posted its strongest monthly gain since last November and, at 58.5, was at its highest since June of 2004. The reading is up from the low of 25.9 last February. Twenty-six percent of firms indicated a higher level of payrolls versus 7% last April. Just 6% showed a lower level versus 35% one year ago. During the last ten years there has been a 90% correlation between the index level and the three-month change in manufacturing payrolls.
Boding well for future hiring, it actually was the production component which posted the strongest m/m increase during April with a rise to 66.9. During the last ten years there has been an 84% correlation between the level of the production component of the composite index and the three-month growth in factory sector industrial production. It is appropriate to correlate the ISM index level with factory sector output growth because the ISM index is a diffusion index. It measures growth by using all of the positive changes in activity added to one half of the zero change in activity measures.
The new orders index also rose and, at 65.7, it showed improvement similar to the hiring index. Fifty-two percent of respondents reported higher orders versus 31% last April. Just 8% reported order declines versus 29% last year. Finally, the export order index slipped just slightly to 61.0 after its March surge to 61.5 which was its highest since 1988. That was up from the low of 35.5 in December '08. During the last ten years there has been a 53% correlation between the index and the q/q change in real exports of goods in the GDP accounts.
Offsetting these increases was a lower inventory component which fell to 49.4 from 55.3 in March. Still, 20% of respondents indicated that they were raising inventory levels versus 11% last April while just 19% indicated lower inventories versus 42% one year ago. Also down and despite improvement in orders and production, the pace of supplier deliveries quickened. The supplier delivery index fell to 61.3 from its March high.
The separate index of prices paid rose to 78.0, a new high for this recovery. That was up from the December '08 low of 18.0. Sixty percent of respondents reported higher prices while only 4% indicated lower prices. During the last twenty years there has been an 83% correlation between the price index and the three-month change in the PPI for intermediate goods.
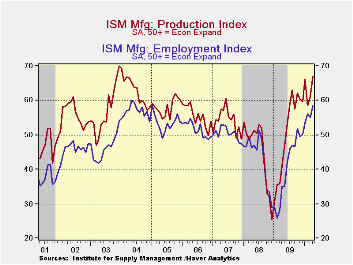
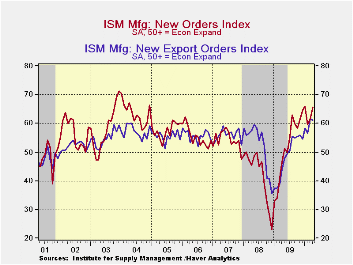
| ISM Mfg | April | March | February | April '09 | 2009 | 2008 | 2007 |
|---|---|---|---|---|---|---|---|
| Composite Index | 60.4 | 59.6 | 56.5 | 40.4 | 46.2 | 45.5 | 51.1 |
| New Orders | 65.7 | 61.5 | 59.5 | 46.5 | 51.6 | 42.1 | 54.3 |
| Employment | 58.5 | 55.1 | 56.1 | 35.0 | 40.5 | 43.3 | 50.5 |
| Production | 66.9 | 61.1 | 58.4 | 41.0 | 50.4 | 45.2 | 54.1 |
| Supplier Deliveries | 61.3 | 64.9 | 61.1 | 45.9 | 51.4 | 51.6 | 51.2 |
| Inventories | 49.4 | 55.3 | 47.3 | 33.7 | 37.1 | 45.5 | 45.4 |
| Prices Paid Index (NSA) | 78.0 | 75.0 | 67.0 | 32.0 | 48.3 | 66.5 | 64.6 |
by Tom Moeller May 3, 2010
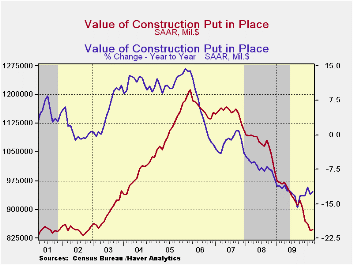
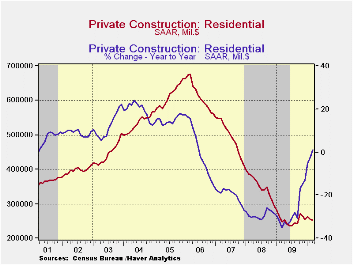
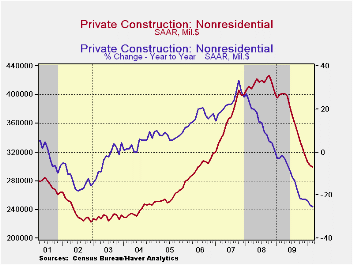
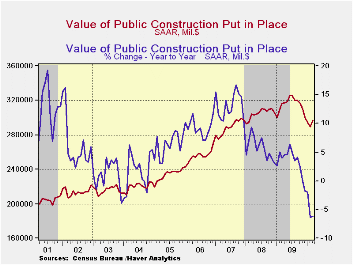
Construction activity remains depressed. The negligible 0.2% uptick in March after the 2.1% February collapse left it near the lowest level since 2003. The latest rise barely beat Consensus expectations for a 0.3% dip.
Total private construction activity continued lower in March, led down by a 1.1% drop in residential building activity. The decline reflected a 6.3% drop (-58.1% y/y) in multi-family building activity and a 3.0% decline (+6.8% y/y) in improvements. Conversely, single-family construction activity rose 1.6% (17.2% y/y). It has risen consecutively m/m since last June.
Nonresidential building activity fell another 0.7% during March and was off by one-quarter during the last twelve months. Spending on lodging fell by nearly two-thirds during the last year while office construction dropped 42%. Retail shopping centers also have developed a hard downward trend (-39.8% y/y) in addition to school construction (-12.6% y/y). Health care construction also has suffered (-16.3% y/y).
In the public sector, building activity bucked the negative trend and rose 2.3% in March. The gain was led by a 23.7% rise (-14.9% y/y) in power-plant construction. Spending on health-care facilities added to the gain with a 4.9% increase (0.0% y/y) while spending on highways & streets rose 1.5% (-1.4% y/y). Building in the education sector fell 2.2% for the month and was down 16.9% y/y.
The construction put-in-place figures are available in Haver's USECON database.
| Construction Put In Place (%) | March | February | January | Y/Y | 2009 | 2008 | 2007 |
|---|---|---|---|---|---|---|---|
| Total | 0.2 | -2.1 | -0.7 | -12.3 | -12.5 | -6.9 | -1.6 |
| Private | -0.9 | -2.4 | -0.1 | -15.3 | -18.8 | -11.1 | -5.7 |
| Residential | -1.1 | -3.4 | 3.8 | 1.2 | -28.0 | -29.1 | -19.7 |
| Nonresidential | -0.7 | -1.5 | -3.3 | -25.5 | -11.1 | 13.2 | 23.1 |
| Public | 2.3 | -1.6 | -1.9 | -6.3 | 3.3 | 5.6 | 13.1 |
by Louise Curley May 3, 2010
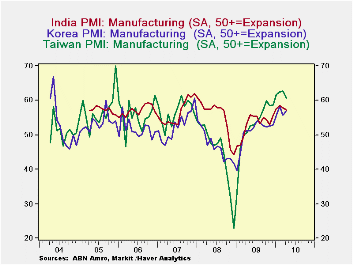
World wide, purchasing managers in the manufacturing industry have become increasingly optimistic. The Markit Economic Survey expresses the responses of the purchasing managers in the form of diffusion indexes that are based on percent balances between those expecting improvement and those expecting deterioration. Values of the index above 50 represent expansion and those below, contraction.
Data for April, 2010 are currently being reported and most of the data show indexes that are now above the 50 level. The first to show expansion were the purchasing manages in the Far East. The first chart shows the diffusion indexes for the purchasing managers of Taiwan, Korea and India, three countries in the Far East for which April data are available. In these countries the indexes began to rise above 50 in early 2009. The second chart shows the indexes for Italy, France and Germany. Purchasing manager in these countries only became optimistic in late 2009. And in the troubled countries of the Euro Area that have reported--Greece, Ireland and Spain--the purchasing managers in Greece have yet to predict expansion while those in Ireland and Spain have only begun to predict expansion in March and April of this year, as can be seen in the third chart.
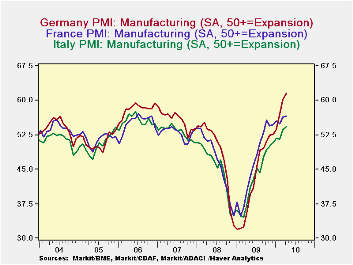
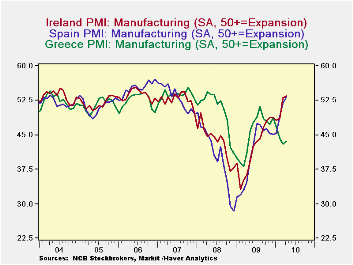
| PMI Diffusion Indexes Manufacturing | April 10 | Mar 10 |
|---|---|---|
| Italy | 54.29 | 53.73 |
| France | 56.55 | 56.47 |
| Germany | 61.51 | 60.23 |
| Taiwan | 60.72 | 62.74 |
| Korea | 57.06 | 55.62 |
| India | 57.24 | 57.73 |
| Greece | 43.64 | 42.94 |
| Ireland | 53.41 | 52.99 |
| Spain | 53.31 | 51.85 |

Tom Moeller
AuthorMore in Author Profile »Prior to joining Haver Analytics in 2000, Mr. Moeller worked as the Economist at Chancellor Capital Management from 1985 to 1999. There, he developed comprehensive economic forecasts and interpreted economic data for equity and fixed income portfolio managers. Also at Chancellor, Mr. Moeller worked as an equity analyst and was responsible for researching and rating companies in the economically sensitive automobile and housing industries for investment in Chancellor’s equity portfolio. Prior to joining Chancellor, Mr. Moeller was an Economist at Citibank from 1979 to 1984. He also analyzed pricing behavior in the metals industry for the Council on Wage and Price Stability in Washington, D.C. In 1999, Mr. Moeller received the award for most accurate forecast from the Forecasters' Club of New York. From 1990 to 1992 he was President of the New York Association for Business Economists. Mr. Moeller earned an M.B.A. in Finance from Fordham University, where he graduated in 1987. He holds a Bachelor of Arts in Economics from George Washington University.
More Economy in Brief


