 Global| Oct 28 2011
U.S. Personal Savings Fall With Weak Income & Firm Spending Growth
by:Tom Moeller
|in:Economy in Brief
Summary
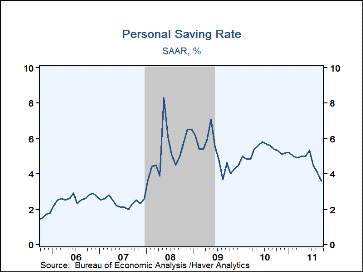
The personal savings rate has been falling since its 2008 monthly peak of 8.3%. However, the latest leg down to 3.6% highlights a marked acceleration in the rate of decline. Despite a sharp deterioration in income growth, consumers [...]
 The personal savings rate has been falling
since its 2008 monthly peak of 8.3%. However, the latest leg down to 3.6%
highlights a marked acceleration in the rate of decline. Despite a sharp
deterioration in income growth, consumers have maintained firm gains in
spending.
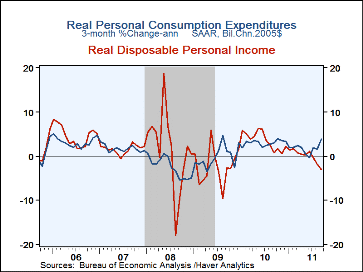
Disposable personal income ticked up 0.1% during September following changes between plus-or-minus 0.1% during the prior three months. When adjusted for prices, 2011 has shown poor growth indeed. Real take-home pay has fallen 0.4% (AR) since December following 1.8% growth during all of last year. The recent slowdown is worse when measured versus q/q growth of 5.6% (AR) during Q2 of last year. Despite the slowdown, growth in spending has been sustained. Personal consumption expenditures rose 0.6% last month. In real terms, the YTD gain of 1.9% (AR) in PCE roughly equals the 2010 increase, though it is off versus the Q4'10 peak of 3.6%.
Overall personal income ticked up 0.1% last month following an unrevised 0.1% August decline. A 0.3% increase had been expected. The uptick left the y/y change a respectable 4.4% but the Q3 increase of 0.9% was down from its Q1 peak of 8.8% (AR). Wages rose 0.3% last month and 3.7% y/y while proprietors' income increased 0.2% (5.2% y/y). Rental income was far stronger as it rose 1.4% (16.4% y/y). Interest income fell 1.4% (+1.2% y/y) following two months of like-decline but dividend income rose 0.5% (7.9% y/y).
Personal consumption expenditures matched expectations and rose 0.6% during September. That followed an unrevised 0.2% August increase. Spending on durable goods jumped 2.2% (6.1% y/y) and reversed a 1.1% August drop. Outlays on motor vehicles jumped 5.4% last month (7.1% y/y) and made up the August decline. Spending on furniture gained 0.7% (4.5% y/y) and apparel increased 1.6% (5.6% y/y). Spending on gasoline jumped 4.1% (28.4% y/y) but when adjusted for higher prices spending rose a lesser 1.3%, and fell 3.3% y/y. Services spending rose 0.2% (3.8% y/y), paced by a 7.1% annual increase in food services & accommodations and a 4.4% y/y increase in recreation services.
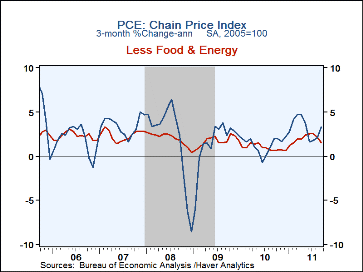
The PCE chain price index rose 0.2% last month (2.9% y/y). The gasoline price index rose 2.8% and by one-third y/y. Food & beverage prices rose 0.5% (5.1% y/y). The core PCE price deflator slipped marginally m/m (+1.6% y/y). That annual increase is up from the record-low 12-month change of 0.9% reached last December. Notable amongst the categories was a 5.1% y/y gain in food services & accommodations, a 3.6% y/y increase in motor vehicles as well as a 3.3% y/y rise in clothing prices. These gains were offset by a 7.0% y/y drop in recreational goods & vehicles and a 0.6% y/y decline in furnishings & household equipment.
The personal income & consumption figures are available in Haver's USECON and USNA databases. The expectations figures are in the AS1REPNA database.
The Growing Difference in College Attainment between Women and Men from the Federal Reserve Bank of Cleveland is available here.
| Personal Income
& Outlays (%) |
Sept | Aug | Jul | Y/Y | 2010 | 2009 | 2008 |
|---|---|---|---|---|---|---|---|
| Personal Income | 0.1 | -0.1 | 0.1 | 4.4 | 3.7 | -4.3 | 4.6 |
| Wages & Salaries | 0.3 | -0.1 | 0.4 | 3.7 | 2.2 | -4.3 | 2.0 |
| Disposable Personal Income |
0.1 | -0.1 | 0.0 | 3.2 | 3.6 | -2.1 | 5.8 |
| Personal Consumption Expenditures |
0.6 | 0.2 | 0.9 | 5.3 | 3.8 | -1.7 | 2.7 |
| Saving Rate | 3.6 | 4.1 | 4.5 | 5.4 (Sept'10) |
5.3 | 5.1 | 5.4 |
| PCE Chain Price Index | 0.2 | 0.3 | 0.4 | 2.9 | 1.8 | 0.2 | 3.3 |
| Less Food & Energy | -0.0 | 0.2 | 0.2 | 1.6 | 1.4 | 1.6 | 2.3 |
| Real Disposable Income |
-0.1 | -0.4 | -0.3 | 0.2 | 1.8 | -2.3 | 2.4 |
| Real Personal Consumption Expenditures |
0.5 | -0.0 | 0.5 | 1.8 | 2.0 | -1.9 | -0.6 |
Tom Moeller
AuthorMore in Author Profile »Prior to joining Haver Analytics in 2000, Mr. Moeller worked as the Economist at Chancellor Capital Management from 1985 to 1999. There, he developed comprehensive economic forecasts and interpreted economic data for equity and fixed income portfolio managers. Also at Chancellor, Mr. Moeller worked as an equity analyst and was responsible for researching and rating companies in the economically sensitive automobile and housing industries for investment in Chancellor’s equity portfolio. Prior to joining Chancellor, Mr. Moeller was an Economist at Citibank from 1979 to 1984. He also analyzed pricing behavior in the metals industry for the Council on Wage and Price Stability in Washington, D.C. In 1999, Mr. Moeller received the award for most accurate forecast from the Forecasters' Club of New York. From 1990 to 1992 he was President of the New York Association for Business Economists. Mr. Moeller earned an M.B.A. in Finance from Fordham University, where he graduated in 1987. He holds a Bachelor of Arts in Economics from George Washington University.


