 Global| Mar 29 2010
U.S. Personal Income &Spending Both Moderate
by:Tom Moeller
|in:Economy in Brief
Summary
Overall personal income was unchanged in February following a 0.3% January increase, originally reported at 0.1%. The latest reading was the weakest since July and it disappointed Consensus expectations for a 0.1% uptick. Though [...]
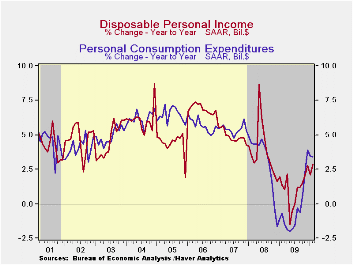 Overall personal income was unchanged in
February following a 0.3% January increase, originally reported at
0.1%. The latest reading was the weakest since July and it disappointed
Consensus expectations for a 0.1% uptick. Though moderate, these gains
were enough to lift yearly income growth to 2.0% after the 1.7% decline
in 2009. The three-month rate of increase also improved to 2.8%.
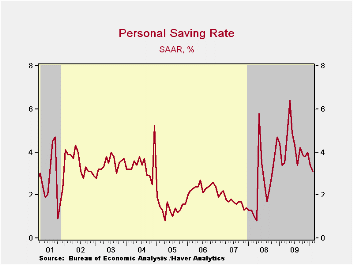
Disposable income was unchanged after January's 0.2% decline. These
moderate income gains caused the savings rate to decline to 3.1%, its
lowest since late-2008. The rate still was up, however, from the 1.0%
low at the beginning of the last recession.
Overall personal income was unchanged in
February following a 0.3% January increase, originally reported at
0.1%. The latest reading was the weakest since July and it disappointed
Consensus expectations for a 0.1% uptick. Though moderate, these gains
were enough to lift yearly income growth to 2.0% after the 1.7% decline
in 2009. The three-month rate of increase also improved to 2.8%.
Disposable income was unchanged after January's 0.2% decline. These
moderate income gains caused the savings rate to decline to 3.1%, its
lowest since late-2008. The rate still was up, however, from the 1.0%
low at the beginning of the last recession.
 Moderate employment declines left wages & salaries
unchanged for the second month in the last three. Nevertheless the
modest y/y drop is improved from the sharp 4.0% decline last year.
Wages in the factory sector slipped by 0.2% and the 4.7% y/y decline
was half that during all of last year. In the private service sector
wages ticked up 0.1% for the second month in the last three. Here
again, however, the 1.0% y/y gain is improved versus last year's 3.8%
decline. Working the other, a 0.1% uptick in government sector wages
was behind a deceleration in y/y growth to 2.3%, its lowest since
early-1994.
Moderate employment declines left wages & salaries
unchanged for the second month in the last three. Nevertheless the
modest y/y drop is improved from the sharp 4.0% decline last year.
Wages in the factory sector slipped by 0.2% and the 4.7% y/y decline
was half that during all of last year. In the private service sector
wages ticked up 0.1% for the second month in the last three. Here
again, however, the 1.0% y/y gain is improved versus last year's 3.8%
decline. Working the other, a 0.1% uptick in government sector wages
was behind a deceleration in y/y growth to 2.3%, its lowest since
early-1994.
The weak housing market pulled proprietors' income down 0.6% (+1.9% y/y) for the second consecutive month. Lower interest rates caused interest income also to slip 0.1% but the y/y change of -0.6% was improved from the 5.3% decline during 2009. Dividend income again fell a sharp 2.8% (-11.6% y/y). Finally, unemployment insurance benefits rose 4.2% (54.4% y/y) and offset a January decline.
Personal spending rose 0.3%, down from 0.4% gains during the prior two months. Spending on gasoline fell 1.0% after the 7.3% January jump. Higher prices kept the y/y gain strong at 31.2% but real spending rose just 0.8% y/y. Nominal apparel spending rose a strong 1.2% (0.1% y/y) while spending on home furnishings rose 0.9% (0.5% y/y). That latter decline is improved from a 6.2% drop during all of last year Spending on services continued firm at 2.6% y/y but that was raised by a 4.5% jump in health care expenditures and a 3.1% gain in spending on financial & insurance. Offsetting these gains was a 3.9% decline in spending on motor vehicles & parts (-0.1% y/y).
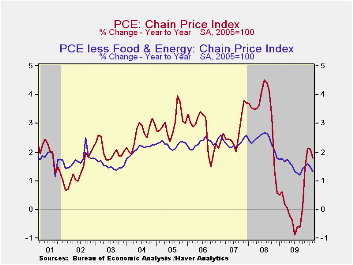
The PCE chain price index slipped modestly with lower gasoline prices. The core PCE price deflator again was unchanged reflecting a 0.6% decline in furniture prices (-1.6% y/y) and a modest 0.3% increase (-4.2% y/y) in appliance prices. Services prices ticked up 0.1% (1.3% y/y) led by a 0.3% gain (2.4% y/y) in health care. Offsetting some of this strength was a 0.5% decline in computer prices (-12.5% y/y) and a 0.7% fall in clothing prices (-0.2% y/y).
The personal income & consumption figures are available in Haver's USECON and USNA databases.
Lessons from the Crisis Stress Tests is the title of last week's speech by Fed Governor Daniel K. Tarullo and it can be found here.

| Disposition of Personal Income (%) | February | January | December | Y/Y | 2009 | 2008 | 2007 |
|---|---|---|---|---|---|---|---|
| Personal Income | 0.0 | 0.3 | 0.4 | 2.0 | -1.7 | 2.9 | 5.6 |
| Disposable Personal Income | 0.0 | -0.2 | 0.5 | 2.8 | 1.1 | 3.9 | 4.9 |
| Personal Consumption Expenditures | 0.3 | 0.4 | 0.4 | 3.4 | -0.4 | 3.1 | 5.4 |
| Saving Rate | 3.1 | 3.4 | 4.0 | 3.4 (Feb.'09) | 4.3 | 2.6 | 1.7 |
| PCE Chain Price Index | -0.0 | 0.2 | 0.2 | 1.8 | 0.2 | 3.3 | 2.7 |
| Less food & energy | 0.0 | -0.0 | 0.1 | 1.3 | 1.5 | 2.4 | 2.4 |
by Louise Curley March 29, 2010

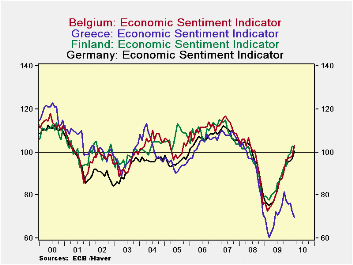
The Economic Sentiment Indicator (ESI) of the European Commission for the 16 countries in the Euro Area rose to 97.9 in March from 95.9 in February. The ESI for the 27 countries in the European Union rose to 99.6 from 97.6. Both indicators have risen substantially from their low points reached in February and March of this year and are close to their long term average of 100, but are well below their pre crisis peak. The first chart shows the history of the two indicators.
The higher level of sentiment in the EU than in the EA suggests that sentiment is somewhat higher in the non Euro Area countries than in the Euro Area Countries. Arithmetically, the low level of sentiment in Greece has reduced the level of average sentiment in the Euro Area, but more important, Greece's problems have no doubt dampened sentiment in the rest of the Euro Area. There were only 3 countries in the Euro Area in March that were at or above 100--Belgium at 103.2, Finland at 102.2 and Germany at 100.4. These countries together with Greece are shown in the second chart.
In the non Euro Area there were four countries where sentiment was at or above 100--the United Kingdom at 100.9, Poland at 101.5, Denmark at 110.0, and Sweden at 111.5. These are shown in the third chart

| Economic Sentiment Indicator | Mar 10 | Feb 10 | Mar 09 | Recent Low | Date |
|---|---|---|---|---|---|
| Euro Area | 97.9 | 95.9 | 96.0 | 68.2 | 2/09 |
| Greece | 69.6 | 72.4 | 76.1 | 60.4 | 3/09 |
| Germany | 100.4 | 97.0 | 96.1 | 75.2 | 3/09 |
| Belgium | 103.2 | 98.1 | 97.7 | 72.6 | 2/09 |
| Finland | 102.2 | 102.8 | 99.4 | 77.7 | 9/09 |
| European Union | 99.6 | 97.6 | 97.2 | 68.2 | 2/09 |
| Denmark | 110.0 | 105.7 | 105.3 | 66.5 | 2/09 |
| Sweden | 111.5 | 110.5 | 106.6 | 78.8 | 4/09 |
| United Kingdom | 100.9 | 98.3 | 98.2 | 65.4 | 2/09 |
| Poland | 101.5 | 98.8 | 94.6 | 79.0 | 3/09 |

Tom Moeller
AuthorMore in Author Profile »Prior to joining Haver Analytics in 2000, Mr. Moeller worked as the Economist at Chancellor Capital Management from 1985 to 1999. There, he developed comprehensive economic forecasts and interpreted economic data for equity and fixed income portfolio managers. Also at Chancellor, Mr. Moeller worked as an equity analyst and was responsible for researching and rating companies in the economically sensitive automobile and housing industries for investment in Chancellor’s equity portfolio. Prior to joining Chancellor, Mr. Moeller was an Economist at Citibank from 1979 to 1984. He also analyzed pricing behavior in the metals industry for the Council on Wage and Price Stability in Washington, D.C. In 1999, Mr. Moeller received the award for most accurate forecast from the Forecasters' Club of New York. From 1990 to 1992 he was President of the New York Association for Business Economists. Mr. Moeller earned an M.B.A. in Finance from Fordham University, where he graduated in 1987. He holds a Bachelor of Arts in Economics from George Washington University.
More Economy in Brief


