 Global| Aug 04 2009
U.S. Personal Income Reverses Large May Gain While Savings Rate Tumbles
by:Tom Moeller
|in:Economy in Brief
Summary
As "automatic stabilizers" vanished, June personal income reversed all of the prior month's jump with a 1.3% decline. Government payments to individuals dropped 6.0% as "other" stimulus payments reversed the May gain with a 16.5% [...]
As "automatic stabilizers" vanished, June personal income
reversed all of the prior month's jump with a 1.3% decline. Government
payments to individuals dropped 6.0% as "other" stimulus payments
reversed the May gain with a 16.5% decline (-7.3% y/y). As might be
expected, wages & salaries, remained under pressure with the
weak job market. The 0.4% decline from May was the ninth decline in the
last ten months (-4.7% y/y). In the goods producing industries, wages
have been particularly hard hit and are down 11.4% y/y. In addition,
the decline in interest rates has taken its toll on interest income
which in June was off 3.7% y/y while fewer dividends were paid by the
corporate sector (-24.4% y/y). These latest figures reflect benchmark
revisions which generally lowered income and the June decline roughly
matched Consensus expectations for a 1.0% drop.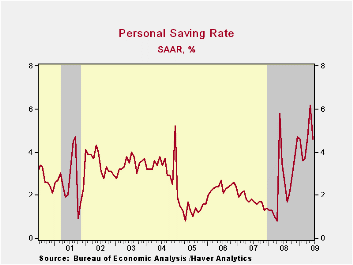
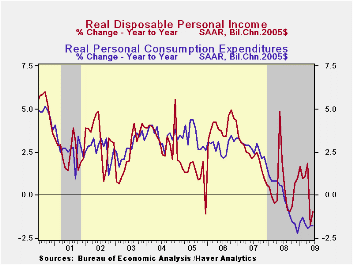
With lower income came lower taxes. Tax payments fell 1.5% last month and they were down by nearly one-quarter since December. Nevertheless, disposable personal income fell 1.3% last month. So far this year disposable income has risen at a 1.7% annual rate which very much reflects sharp downward revisions to earlier figures. Adjusted for inflation, real disposable income also reversed the May gain and fell 1.8%. Revisions dropped growth in real take-home pay to a negative 0.4% since December whereas earlier figures showed firm growth.
Whatever it takes, consumers have attempted to rebuild their
balance sheets. Though the personal savings rate backpedaled last month
with the income drop, the 4.6% figure was near the highest since 1998
despite the downward income revisions.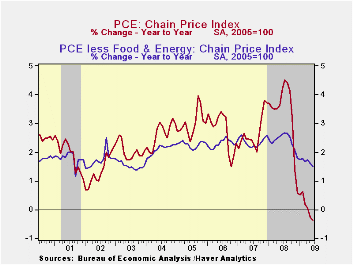
Restraint on spending has driven the rise in savings. June personal consumption expenditures about matched expectations and rose just 0.4%. They are up 2.5% at a annual rate so far this year. However, that growth largely reflects the rise in gasoline prices. Adjusted for inflation, June spending slipped 0.1% and so far this year it is up at just a 0.4% annual rate. (The details behind this restraint will be available later this week.)
Pricing power continues to held back by sluggish spending. The PCE chain price index rose 0.5% last month, largely due to the rise in energy prices. Less food and energy prices rose just 0.2%. Combined with weakness during prior months, the y/y gain in core prices dropped to 1.5% which was its lowest since 2003. The latest increase in prices matched Consensus expectations.
The personal income & consumption figures are available in Haver's USECON and USNA databases.
Bank Supervision is today's Senate testimony by Fed Governor Daniel K. Tarullo and it can be found here.
| Disposition of Personal Income (%) | June | May | Y/Y | 2008 | 2007 |
|---|---|---|---|---|---|
| Personal Income | -1.3 | 1.3 | -3.4 | 2.9 | 5.6 |
| Disposable Personal Income | -1.3 | 1.6 | -1.3 | 3.9 | 4.9 |
| Personal Consumption Expenditures | 0.4 | 0.1 | -2.2 | 3.1 | 5.4 |
| Saving Rate | 4.6 | 6.2 | 3.5 (June '08) | 2.6 | 1.7 |
| PCE Chain Price Index | 0.5 | 0.1 | -0.4 | 3.3 | 2.7 |
| Less food & energy | 0.2 | 0.1 | 1.5 | 2.4 | 2.4 |
by Tom Moeller August 4, 2009
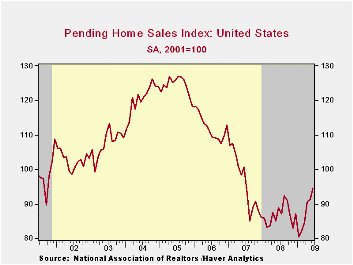
The rebound in housing activity grew stronger last month as mortgage rates remained low. The National Association of Realtors reported that June pending sales of existing homes jumped 3.6% from May to their highest level since June of 2007. The gain easily outpaced Consensus expectations for a slight 0.6% increase in monthly sales.
Home sales rose last month in each of the country's regions, but they surged in the South and the West. In the South, sales jumped 7.1% m/m to lift them nearly nine percent from June of 2008. In the West, sales also were strong and posted a 7.1% gain. Though strong last month, sales have meandered sideways for the last year. In the Northeast, sales ticked up just 0.4% from May. That followed strong gains during three of the prior four months and left them at their highest in two years. Finally, sales in the Midwest also rose but by a slight 0.8% m/m; nevertheless, they were at their highest level since 2007.
These home sales figures are analogous to the new home sales
data from the Commerce Department in that they measure existing home
sales when the sales contract is signed, not at the time the sale is
closed. The series dates back to 2001.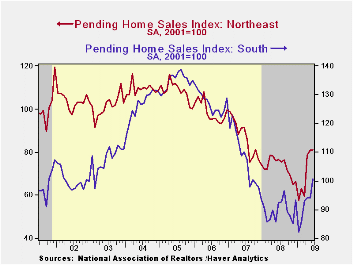
The latest monthly gains in home sales have been accompanied by improvement in prices. The median sales price of an existing home increased 4.1% in June (-15.4% y/y) and prices have risen 7.1% since December. That latest increase reduced the affordability index of a home but it nevertheless remained up by 29.9% year-to-year and by three-quarters from the 2006 low. The median price of an existing home rose to $181,600 (-15.0% y/y) and the average mortgage rate was 5.2%, down from 6.3% one year ago.
The Realtors Association indicated in an earlier report that the number of homes on the market and available for sale slipped m/m and was down 14.9% versus one year earlier. At the current sales rate, there was a 9.4 months' supply of homes on the market which was near the lowest since June 2007. However, it still was up from the 8.9 months supply during all of 2007 and 6.5 months during 2006. At the high, there was a 10.4 months supply during all of last year.
The pending home sales data are available in Haver's PREALTOR database. The number of homes on the market and prices are in the REALTOR database.
| Pending Home Sales (2001=100) | June | May | Y/Y | 2008 | 2007 | 2006 |
|---|---|---|---|---|---|---|
| Total | 94.6 | 91.3 | 6.7% | 86.8 | 95.8 | 112.1 |
| Northeast | 81.2 | 80.9 | 5.9 | 72.6 | 85.6 | 98.5 |
| Midwest | 89.9 | 89.2 | 11.5 | 80.6 | 89.5 | 102.0 |
| South | 100.7 | 94.0 | 8.9 | 89.8 | 107.3 | 127.3 |
| West | 100.4 | 97.6 | -0.2 | 99.3 | 92.1 | 109.5 |
by Tom Moeller August 4, 2009
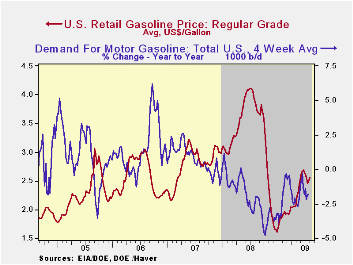
The economy must be improving if gasoline prices are rising. Or is it seasonal strength? The pump price for regular gasoline increased last week to an average $2.56 per gallon, though that still was down a nickel from last month's high. The increase added to the nearly one dollar (59%) rise from the December low. Yesterday, however, the pricing strength was even more evident with the twenty cent jump to $2.03 per gallon in the cash market price. Gasoline prices were up off the early-July low of $1.60. The figures are reported by the U.S. Department of Energy and can be found in Haver's WEEKLY & DAILY databases.
Crude oil prices also have strengthened.
Light sweet crude oil prices (WTI) increased to $67.23 per barrel and
they've roughly doubled this year. Yesterday the spot market price for
light sweet crude oil rose further to $71.58 per barrel. Prices had
reached a daily high of $72.68 earlier in July.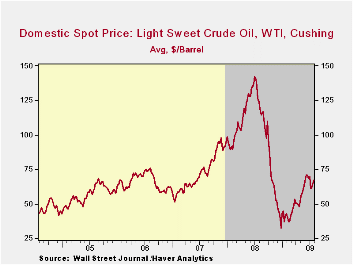
The pickup in energy prices is against the backdrop of a firming demand picture. It probably is seasonal, but during the last four weeks the demand for gasoline is up sharply. Year-to year, demand still is down by 1.8%, but that compares to a nearly 5% rate of decline last fall. Demand for distillate also is off sharply though residual fuel oil demand has moved higher. Finally, oil remains plentiful as evidenced by a 13.0% y/y rise in inventories of crude oil & petroleum products. Inventories of gasoline are flat y/y but crude oil inventories less the SPR are up by 17.8%. The figures on crude oil production and inventories are available in Haver's OILWKLY database.
Natural gas prices continued their move sideways last week. At an average of $3.44 per mmbtu (-62.8% y/y), the price was down by three-quarters from the high reached in early-July of last year of $13.19/mmbtu.
| Weekly Prices | 08/03/09 | 07/27/09 | Y/Y | 2008 | 2007 | 2006 |
|---|---|---|---|---|---|---|
| Retail Regular Gasoline ($ per Gallon, Regular) | 2.56 | 2.50 | -34.1% | 3.25 | 2.80 | 2.57 |
| Light Sweet Crude Oil, WTI ($ per bbl.) | 67.23 | 64.72 | -45.0% | 100.16 | 72.25 | 66.12 |
by Robert Brusca August 4, 2009
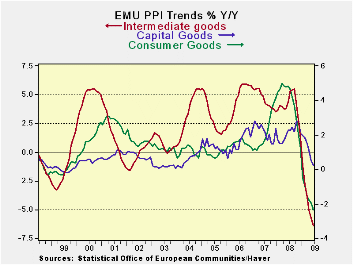
EMU producer prices (x-construction) ticked up in June but are
still falling at an accelerating pace Year-over-year. Sector prices are
weak and falling across the board on all horizons but the rate of
descent is not gathering momentum overall or by sector. In the end that
is the really good news.
Germany shows prices falling over three-months at about the
same pace they are falling over six months, both of which are at a
faster pace of decline than year-over-year. But core German prices,
Italian prices and UK prices, in particular, are not showing any
continuing deceleration: declines yes, but decelerations, no. In the UK
PPI prices have started to rise. In Italy the down turn has abated and
there is one month in which the PPI headline rate has risen (June).
German trends are marked by still declining headline and core rates
even monthly, but the move down is not accelerating.
In short inflation appears to be contained and deflation does
not seem to be in the cards on a sampling of big picture EMU sector
news and smattering of country-level reports. Lingering economic
weakness is probably having this extended impact in depressing prices.
| Euro Area and UK PPI Trends | ||||||
|---|---|---|---|---|---|---|
| M/M | Saar | |||||
| Euro Area | Jun-09 | May-09 | 3-Mo | 6-MO | Yr/Yr | Y/Y Yr Ago |
| Total excl Constructions | 0.2% | -0.2% | -4.5% | -7.8% | -6.7% | 7.9% |
| Capital Goods | 0.0% | -0.3% | -1.2% | -1.2% | 0.3% | 2.3% |
| Consumer Goods | -0.1% | 0.0% | -0.7% | -3.6% | -2.3% | 4.8% |
| Intermediate & Capital Goods | 0.0% | -0.4% | -5.2% | -9.4% | -6.4% | 4.3% |
| MFG | 0.5% | -0.1% | -0.4% | -5.0% | -7.4% | 7.2% |
| Germany | -0.1% | 0.0% | -9.4% | -9.8% | -3.3% | 5.1% |
| Germany excl Energy | -0.1% | -0.2% | -2.3% | -4.1% | -2.8% | 2.7% |
| Italy | 0.2% | -0.2% | -2.9% | -6.6% | -7.2% | 8.1% |
| UK | 1.1% | 0.5% | 1.5% | 2.1% | -8.6% | 24.1% |
| E-zone Harmonized PPI ex construction | ||||||
| The EA 13 countries are Austria, Belgium, Finland, France, Germany, Greece, Ireland, Italy, Luxembourg, the Netherlands, Portugal, Slovenia | ||||||
by Louise Curley August 4, 2009
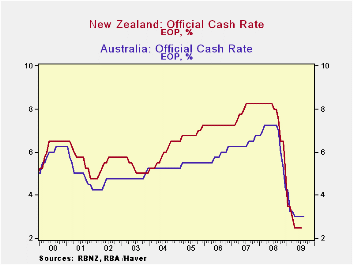
The official policy interest rates in both Australia and New
Zealand have been unchanged since May of this year--Australia at 3% and
New Zealand at 2.5%, as can be seen in the first chart. In recent news
releases, Glenn Stevens, the Governor of the Bank of Australia, hinted
that the next move might be an increase while Alan Bollard,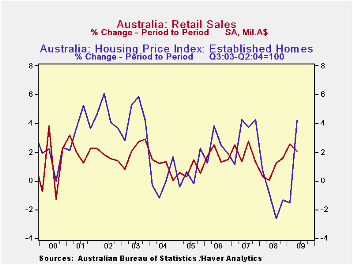 Governor of
the Bank of New Zealand would not rule out further reductions.
Governor of
the Bank of New Zealand would not rule out further reductions.
Typical of the cross currents affecting these economies are
today's updates of the Haver data bases for the two countries. In
Australia, retail sales were down slightly in June, but on a quarterly
basis, the second quarter was 2% above the first quarter and almost 8%
above the second quarter of 2008. 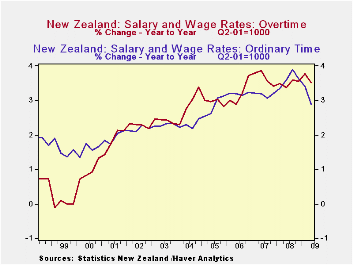 An index of house prices of
established homes in eight capital cities increased 4.2% in the second
quarter from the first quarter of this year and was only 1.4% below the
value of the index in the second quarter of 2008. The quarter to
quarter changes in retail sales and house prices are shown in the
second chart.
An index of house prices of
established homes in eight capital cities increased 4.2% in the second
quarter from the first quarter of this year and was only 1.4% below the
value of the index in the second quarter of 2008. The quarter to
quarter changes in retail sales and house prices are shown in the
second chart.
 In New Zealand wages and salaries are still rising, both for
ordinary hours and for overtime, but the rate of increase has declined
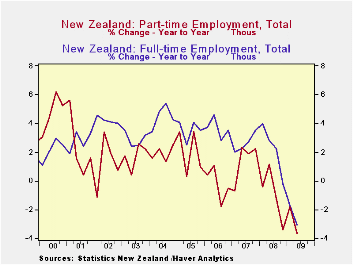
in the past few quarters, as shown in the third chart. Employment
continues to decline and was 0.75% lower in the second quarter than in
the first quarter and more than 3% lower than the second quarter of
2008. Part Time and Full Time employment trends are shown in the fourth
chart.
In New Zealand wages and salaries are still rising, both for
ordinary hours and for overtime, but the rate of increase has declined
in the past few quarters, as shown in the third chart. Employment
continues to decline and was 0.75% lower in the second quarter than in
the first quarter and more than 3% lower than the second quarter of
2008. Part Time and Full Time employment trends are shown in the fourth
chart.
| Q2 09 | Q1 09 | Q2 08 | Q/Q % | Y/Y % | 2008 | 2007 | 2006 | |
|---|---|---|---|---|---|---|---|---|
| AUSTRALIA | ||||||||
| Retail Sales (Millions A$) | 58,615 | 57,426 | 54,406 | 2.07 | 7.67 | 219,968 | 211,255 | 195.254 |
| House Price Index (Q2,2003-Q2,2004=100) | 128.1 | 122.9 | 129.4 | 4.23 | -1.39 | 128.0 | 122.7 | 110.2 |
| NEW ZEALAND | ||||||||
| Employment (000) | 1355 | 1365 | 1400 | -0.75 | -3.19 | 1392 | 1370 | 1338 |
| Wages Ordinary Time (Q2 2001=1000) | 1244 | 1240 | 1209 | 0.32 | 2.89 | 1216 | 1174 | 1138 |
| Wages Over Time (Q2 2001=1000) | 1268 | 1262 | 1225 | 0.48 | 3.51 | 1233 | 1192 | 1150 |

Tom Moeller
AuthorMore in Author Profile »Prior to joining Haver Analytics in 2000, Mr. Moeller worked as the Economist at Chancellor Capital Management from 1985 to 1999. There, he developed comprehensive economic forecasts and interpreted economic data for equity and fixed income portfolio managers. Also at Chancellor, Mr. Moeller worked as an equity analyst and was responsible for researching and rating companies in the economically sensitive automobile and housing industries for investment in Chancellor’s equity portfolio. Prior to joining Chancellor, Mr. Moeller was an Economist at Citibank from 1979 to 1984. He also analyzed pricing behavior in the metals industry for the Council on Wage and Price Stability in Washington, D.C. In 1999, Mr. Moeller received the award for most accurate forecast from the Forecasters' Club of New York. From 1990 to 1992 he was President of the New York Association for Business Economists. Mr. Moeller earned an M.B.A. in Finance from Fordham University, where he graduated in 1987. He holds a Bachelor of Arts in Economics from George Washington University.
More Economy in Brief


