 Global| Mar 01 2010
U.S. Personal Income Remains Weak
by:Tom Moeller
|in:Economy in Brief
Summary
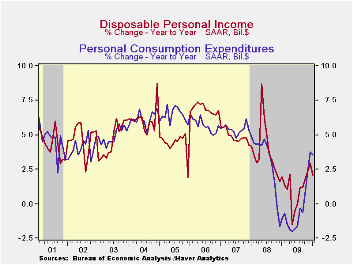
Overall personal income ticked up just 0.1% in January following downwardly revised increases during the prior two months. The latest weak increase disappointed Consensus expectations for a 0.4% rise. Declines spread through much of [...]
 Overall
personal
income ticked up just 0.1% in January following downwardly
revised increases during the prior two months. The latest weak increase
disappointed Consensus expectations for a 0.4% rise.
Overall
personal
income ticked up just 0.1% in January following downwardly
revised increases during the prior two months. The latest weak increase
disappointed Consensus expectations for a 0.4% rise.
Declines spread through much of the income spectrum. The weak housing market pulled proprietors' income down 0.3% (+1.6% y/y) and rental income fell 0.3%, the first decline since 2007. Lower interest rates caused interest income also to fall 0.3% though the y/y change of -2.7% was improved from the worst of last September (-8.2% y/y). Dividend income fell 3.0% (-13.3% y/y) though that y/y change was half its worst. Finally, the improved job market and the expiration of long-term benefits caused a 2.2% decline in unemployment insurance payments, the fourth consecutive monthly decline (+36.6% y/y).
To the upside, wages & salaries improved 0.4% after an unrevised 0.1% December increase. Year-to-year growth was still a negative 1.0% but improved from -4.9% during last summer. Wages in the factory sector rose 0.8% but still remained 5.8% lower than last year. In the private service sector wages rose 0.3% following a downwardly revised 0.1% December reading. Government sector wages did increase 0.5% but weak hiring cut the y/y increase to 2.4%, its lowest since early 1994.
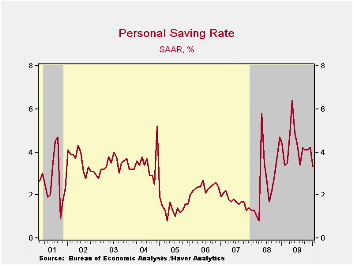
Disposable income fell 0.4% and reversed the prior month's increase as tax payments jumped 5.5%. The income decline caused the savings rate to decline to 3.3%, its lowest since late-2008. The rate still was up, however, from the 1.0% low at the beginning of the last recession.
Personal spending rose 0.5% last month following little-revised increases of 0.3%-to-0.5% during the prior three periods. A 7.0% m/m rise in spending on gasoline (41.5% y/y) led the increase as prices spiked, but the real gain was just 2.1% (0.8% y/y). Nominal apparel spending gained 0.6% (1.6% y/y) while outlays on services rose a weakened 0.2% (2.1% y/y). To the downside, spending on motor vehicles & parts fell 1.2% (+5.6% y/y) and spending on home furnishings fell for the third month in the last four (-0.4% y/y).
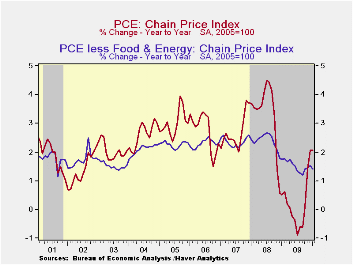
The PCE chain price index ticked up just 0.2% during January and 2.1% y/y with higher gasoline prices. The core PCE price deflator was unchanged during January and that reflected weakness throughout the categories.
The personal income & consumption figures are available in Haver's USECON and USNA databases.
| Disposition of Personal Income (%) | January | December | November | Y/Y | 2009 | 2008 | 2007 |
|---|---|---|---|---|---|---|---|
| Personal Income | 0.1 | 0.3 | 0.4 | 1.1 | -1.7 | 2.9 | 5.6 |
| Disposable Personal Income | -0.4 | 0.4 | 0.5 | 2.1 | 1.1 | 3.9 | 4.9 |
| Personal Consumption Expenditures | 0.5 | 0.3 | 0.5 | 3.5 | -0.4 | 3.1 | 5.4 |
| Saving Rate | 3.3 | 4.2 | 4.1 | 4.4 (Jan.'09) | 4.3 | 2.6 | 1.7 |
| PCE Chain Price Index | 0.2 | 0.1 | 0.2 | 2.1 | 0.2 | 3.3 | 2.7 |
| Less food & energy | 0.0 | 0.1 | 0.1 | 1.4 | 1.5 | 2.4 | 2.4 |
by Tom Moeller March 1, 2010
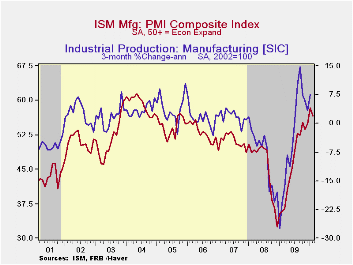 The
rate of
factory sector improvement eased slightly last month, according to the
Institute for Supply Management. Perhaps due to cold weather, the
February composite index slipped to 56.5 from January's 58.4. The
latest remained the second highest reading of the economic recovery. It
was up from the low of 32.9 reached in December '08. The latest figure
fell short of Consensus expectations for a reading of 57.8. (Any figure
above the break-even point of 50 suggests rising activity.) The ISM
data is available in Haver's USECON database.
The
rate of
factory sector improvement eased slightly last month, according to the
Institute for Supply Management. Perhaps due to cold weather, the
February composite index slipped to 56.5 from January's 58.4. The
latest remained the second highest reading of the economic recovery. It
was up from the low of 32.9 reached in December '08. The latest figure
fell short of Consensus expectations for a reading of 57.8. (Any figure
above the break-even point of 50 suggests rising activity.) The ISM
data is available in Haver's USECON database.
Declines in the production and new orders components accounted for the decline in the composite index. During the last ten years there has been an 84% correlation between the level of the production component of the composite index and the three-month growth in factory sector industrial production. It is appropriate to correlate the ISM index level with factory sector output growth because the ISM index is a diffusion index. It measures growth by using all of the positive changes in activity added to one half of the zero change in activity measures. Finally, the export order index fell to 56.5 and reversed half of its January increase. It still was up, however, from the low of 35.5 in December '08. During the last ten years there has been a 53% correlation between the index and the q/q change in real exports of goods in the GDP accounts.
To the upside was the employment index with a gain to 56.1, the highest level since 2005. It's up from a low reading of 25.9 last February. Twenty-two percent of firms indicated a higher level of payrolls versus 6% last February. Ten percent showed a lower level versus 54% last February. During the last ten years there has been a 90% correlation between the index level and the three-month change in manufacturing payrolls.
The rise in the inventory component to 47.3 brought it back to the October high. Nineteen percent of respondents reported lower inventories versus 43 percent last February. Seventeen percent (NSA) of respondents indicated that they were raising inventory levels versus 19% last February. During the strong 2005 inventory accumulation 26% of firms indicated that they were raising inventories. The vendor performance indicator, which measures the speed of deliveries, rose and indicated the slowest speed since 2005.
The separate index of prices paid fell from its cycle-high to 67.0. That still was up from the December '08 low of 18.0. During the last twenty years there has been a 79% correlation between the price index and the three-month change in the PPI for intermediate goods. Thirty-nine percent of respondents reported higher prices while only 5 percent indicated lower prices.
The ISM data are available in Haver's USECON database.
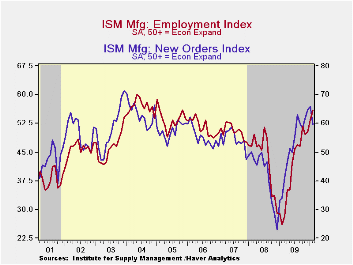
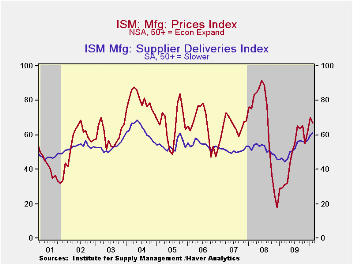
| ISM Mfg | February | January | December | Feb. '09 | 2009 | 2008 | 2007 |
|---|---|---|---|---|---|---|---|
| Composite Index | 56.5 | 58.4 | 54.9 | 35.7 | 46.2 | 45.5 | 51.1 |
| New Orders | 59.5 | 65.9 | 64.8 | 33.9 | 51.6 | 42.1 | 54.3 |
| Employment | 56.1 | 53.3 | 50.2 | 25.9 | 40.5 | 43.3 | 50.5 |
| Production | 58.4 | 66.2 | 59.7 | 35.6 | 50.4 | 45.2 | 54.1 |
| Supplier Deliveries | 61.1 | 60.1 | 56.8 | 46.6 | 51.4 | 51.6 | 51.2 |
| Inventories | 47.3 | 46.5 | 43.0 | 36.7 | 37.1 | 45.5 | 45.4 |
| Prices Paid Index (NSA) | 67.0 | 70.0 | 61.5 | 29.0 | 48.3 | 66.5 | 64.6 |
by Tom Moeller March 1, 2010
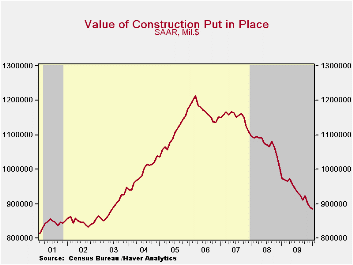 Construction
activity continued to move lower in January to the lowest level since
2003. Construction outlays fell 0.6% following an unrevised 1.2%
December decline but the November drop was doubled. The latest decline
roughly equaled the Consensus estimate.
Construction
activity continued to move lower in January to the lowest level since
2003. Construction outlays fell 0.6% following an unrevised 1.2%
December decline but the November drop was doubled. The latest decline
roughly equaled the Consensus estimate.
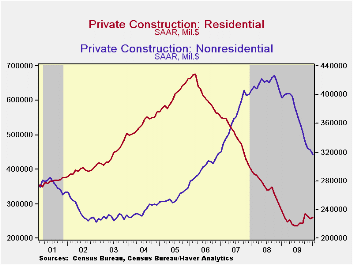
Although the level of total private construction activity continued lower in January, residential building activity increased for the first time in three months. All of the gain was, however, due to a 4.7% rise (10.6% y/y) in spending on home improvements. Single-family construction activity slipped 0.2% (-8.6% y/y) while multi-family building dropped a sharp 11.1% and was off one-half from the year ago level.
Nonresidential building activity fell another 2.1% during January and was off 19.9% during the last twelve months. Since the 2008 peak, activity has fallen by one-quarter. Spending on lodging fell 9.8% during January (-46.0% y/y) while office construction dropped 1.6% (-34.25 y/y). Health care construction fell a lesser 0.5% (-10.6% y/y) and educational building also slipped just 0.7% (-15.8% y/y).
In the public sector, building activity slipped 0.7% as commercial building fell 9.6% (+9.9% y/y). Spending on highways & streets offset that decline with a 1.2% increase (5.5% y/y). Public spending on health care facilities fell a sharp 8.2% m/m but remained up modestly. Building in the education sector was unchanged for the month and down 6.2% from last January.
The construction put-in-place figures are available in Haver's USECON database.
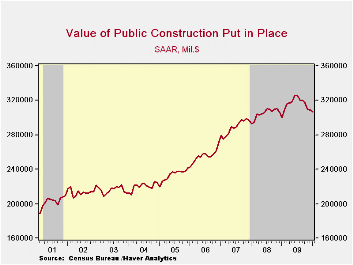
| Construction Put In Place (%) | January | December | November | Y/Y | 2009 | 2008 | 2007 |
|---|---|---|---|---|---|---|---|
| Total | -0.6 | -1.2 | -2.5 | -9.3 | -12.4 | -6.9 | -1.6 |
| Private | -0.6 | -1.7 | -2.6 | -14.3 | -18.7 | -11.1 | -5.7 |
| Residential | 1.3 | -2.8 | -2.5 | -6.4 | -27.9 | -29.1 | -19.7 |
| Nonresidential | -2.1 | -0.7 | -2.7 | -19.9 | -10.9 | 13.2 | 23.1 |
| Public | -0.7 | -0.4 | -2.2 | 2.1 | 3.6 | 5.6 | 13.1 |
by Robert Brusca March 1, 2010
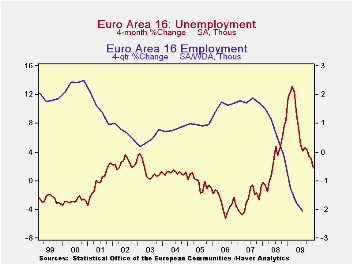
The unemployment rate in the Euro-Area has flattened out just under 10%. And while the number of unemployed continues to rise the increase is at a decreasing pace- a good sign or at least a logical first step. In the larger EU area the pace of the increase in unemployment over three months is 1.9% well below the 5.4% pace over six months and 19.8% annual rate over the last 12-monhts.
EMU is doing better still. While all EMU countries are in the EU, the EMU set is a smaller group that shares a common currency, the euro. For this group the number of unemployed is rising at a 1.1% pace over three-months a 4.2% pace over six-months and a 16.4% pace over twelve-months. EMU unemployment is rising more slowly than in the EU over all these horizons.
Still the EMU’s Spain continues with a horrific 18.8 percent rate of unemployment as Spain’s property market boom and bust has proved to be very difficult to remedy.
The focus of attention in the Zone continues to be Greece with its ongoing problems. Talk from Germany and from the EU Commission continues to be tough. Greece says it needs help, not money. But the markets are improving and the euro itself is rising on rumors that some deal has been cooked up. It is hard to see how Greece can re-group without financial aid and perhaps some added credit backing. German and French banks already are greatly exposed to the Greek credit making them likely participants in a bail our or ‘assistance package’ for Greece. In any event it is clear that Europe does not want Greece to be the Lehman Brothers of Europe but they do want Greece to do more for itself so the pain is obvious to any other euro-member that might contemplate the same path that Greece took. Still, Europe does not want to let Greece go down and see what else is dragged into the resulting whirlpool. There are too many other potentially weak euro-members, enough that it could really stretch the ability of the monetary union’s strongest members to help them all. Holding the line on Greece is what makes the most sense. So look for a deal.
It is easier to do this in an environment, in which the economies are improving. With the slight nudge up to the market MFG PMI for the Zone today there is a new cycle high for the MFG index and reason for hope that he dig-out from recession continues. Sometime this week we should get some clearer news on the fate of Greece. The fat is in the fire and it is sizzling.
| Unemployment rate and changes | ||||||
|---|---|---|---|---|---|---|
| Rate | Level | Simple Changes | ||||
| Jan-10 | Dec-09 | Nov-09 | 3-Mo | 6-Mo | 12-Mo | |
| EU-Urate | 9.5 | 9.5 | 9.4 | 0.1 | 0.4 | 1.5 |
| EMU-Urate | 9.9 | 9.9 | 9.9 | 0.1 | 0.4 | 1.4 |
| Unemployment rate and changes | m/m% | Changes (ar) | ||||
| EU-U 000s | 0.6% | 0.7% | 0.6% | 1.9% | 5.4% | 19.8% |
| EMU-U 000s | 0.2% | 0.4% | 0.4% | 1.1% | 4.2% | 16.4% |
| U-Rates | Level | Simple Changes | ||||
| Germany | 7.5 | 7.5 | 7.5 | 0 | -0.1 | 0.3 |
| France | 10.1 | 10 | 10 | 0.2 | 0.6 | 1.4 |
| Spain | 18.8 | 18.9 | 18.9 | -0.2 | 0.4 | 3 |
| USA | 9.7 | 10 | 10 | -0.4 | 0.3 | 2 |
| Japan | #N/A | 5.1 | 5.2 | #N/A | #N/A | #N/A |
by Louise Curley March 1, 2010
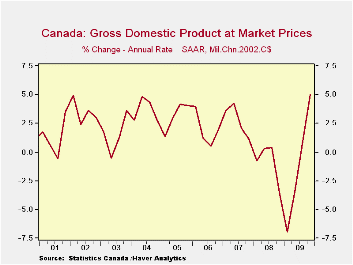
The Canadian economy grew at a 5% annual rate in the fourth of last year. It was the second quarter of growth following the three quarter recession and represented a substantial acceleration from the 0.94% seasonally adjusted annual rate of the third quarter, as can be seen in the attached chart.
In addition to the rate of growth, the composition of the growth is particularly important for monetary policy decisions. Statistics Canada provides a table showing the composition of the quarter to quarter changes in real GDP. This table can be found in the National Accounts section of the Haver Analytics data base, CANSIM. The components of the table are listed below.
The acceleration in growth in the fourth quarter was due largely to trends in foreign trade. Exports of goods and services were greater and imports of goods and services were sharply lower than those in the third quarter. As imports detract from growth, a reduction in imports from one quarter to the next leads to a higher GDP. The contribution of domestic demand was much smaller than it was in the third quarter. Personal and government consumption and business and government investment all showed lower growth in the fourth quarter than in the third. Thus in spite of the 5% annual rate of increase in the fourth quarter, there is little evidence that the economy is overheating.
| Contribution to Q/Q Percent Change in GDP | Q4 09 | Q3 09 | Q2 09 | Q3 09 | Q4 08 |
|---|---|---|---|---|---|
| Q/Q Percent Change in GDP | 1.233 | 0.235 | -0.875 | -1.785 | -0.940 |
| Personal Consumption Expenditures | 0.517 | 0.530 | 0.238 | -0.191 | -0.443 |
| Govt. Current Expenditures | 0.309 | 0.332 | 0.181 | 0.104 | 0.121 |
| Govt. Investment in Inventory | 0.002 | 0.001 | 0.000 | -0.007 | 0.012 |
| Govt. Fixed Investment | 0.155 | 0.223 | 0.154 | 0.07 | 0.072 |
| Business Investment in Inventory | -0.181 | 0.329 | 0.082 | -1.193 | -0.305 |
| Business Fixed Investment | 0.188 | 0.323 | -0.505 | -1.909 | -0.992 |
| Exports of Goods and Services | 1.027 | 0.804 | -1.526 | -2.863 | -1.707 |
| Imports of Goods and Services | -0.653 | -2.313 | 0.443 | 4.035 | 2.292 |
| Statistical Discrepancy | -0.131 | 0.007 | 0.058 | 0.131 | 0.003 |
| Final Domestic Demand | 0.952 | 5.352 | 7.944 | -2.700 | -5.420 |

Tom Moeller
AuthorMore in Author Profile »Prior to joining Haver Analytics in 2000, Mr. Moeller worked as the Economist at Chancellor Capital Management from 1985 to 1999. There, he developed comprehensive economic forecasts and interpreted economic data for equity and fixed income portfolio managers. Also at Chancellor, Mr. Moeller worked as an equity analyst and was responsible for researching and rating companies in the economically sensitive automobile and housing industries for investment in Chancellor’s equity portfolio. Prior to joining Chancellor, Mr. Moeller was an Economist at Citibank from 1979 to 1984. He also analyzed pricing behavior in the metals industry for the Council on Wage and Price Stability in Washington, D.C. In 1999, Mr. Moeller received the award for most accurate forecast from the Forecasters' Club of New York. From 1990 to 1992 he was President of the New York Association for Business Economists. Mr. Moeller earned an M.B.A. in Finance from Fordham University, where he graduated in 1987. He holds a Bachelor of Arts in Economics from George Washington University.
More Economy in Brief


