 Global| Oct 31 2005
U.S. Personal Income Lifted By Insurance Payments
by:Tom Moeller
|in:Economy in Brief
Summary
Insurance payments following hurricanes Katrina and Rita rose $120B (AR) and lifted personal income by 1.7% in September after a 0.9% August decline that was much deeper than initially reported. It was the largest monthly increase in [...]
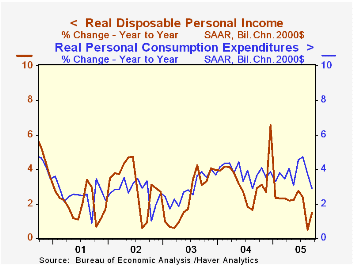
Insurance payments following hurricanes Katrina and Rita rose $120B (AR) and lifted personal income by 1.7% in September after a 0.9% August decline that was much deeper than initially reported. It was the largest monthly increase in income since a 3.7% jump last December and exceeded Consensus expectations for a 0.3% rise.
Wages & salaries rose 0.3% (6.0% y/y) last month following a downwardly revised 0.1% August increase. Factory sector wages fell 0.5% (+3.4% y/y) and service sector wages rose 0.3% (6.9% y/y).
Disposable personal income jumped 1.9% (5.3% y/y) following a 1.1% drop in August that was initially reported at -0.1%. Adjusted for prices which rose 0.9%, take home pay rose 1.0% (1.5% y/y) after a 1.5% decline in August.
The PCE chain price index surged 0.9% last month as gasoline prices jumped 16.8% m/m, but gasoline prices have since retraced much of that increase. Less food & energy prices rose 0.2% following a downwardly revised 0.1% rise in August.
Personal consumption expenditures recovered about all of the prior month's unrevised 0.5% decline even though a 2.4% m/m decline in light vehicle sales lowered spending on durables by 2.3% (+1.6% y/y). Nondurables outlays jumped 1.3% (9.8% y/y), however, adjusted for higher prices spending on nondurables fell 1.0% (+2.9% y/y). Services spending rose 0.6% (6.2% y/y).
The personal savings rate remained negative for the fourth consecutive month. The Federal Reserve indicated last week that household sector net worth (from the Flow of Funds Accounts) improved in 2Q to a four year high due to an increase in owners' equity in real estate which has averaged 11.3% per year since 2001.
| Disposition of Personal Income | Sept | Aug | Y/Y | 2004 | 2003 | 2002 |
|---|---|---|---|---|---|---|
| Personal Income | 1.7% | -0.9% | 6.3% | 5.9% | 3.2% | 1.8% |
| Personal Consumption | 0.5% | -0.5% | 6.7% | 6.5% | 4.9% | 4.2% |
| Savings Rate | -0.4% | -1.8% | 1.5% | 1.7% | 2.1% | 2.4% |
| PCE Chain Price Index | 0.9% | 0.4% | 3.8% | 2.6% | 1.9% | 1.4% |
| Less food & energy | 0.2% | 0.1% | 2.0% | 2.0% | 1.3% | 1.8% |
by Tom Moeller October 31, 2005
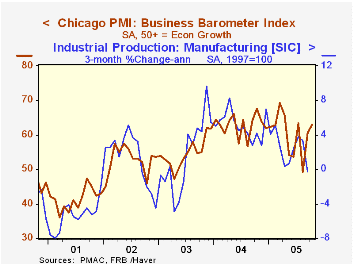
For the second consecutive month, the Chicago Purchasing Managers Business Barometer improved unexpectedly. The October Business Barometer rose to 62.9 after a huge gain in September and easily outpaced Consensus expectations for a slight decline to 58.
During the last ten years there has been a 65% correlation between the level of Chicago PMI and the three month change in factory sector industrial production.
The new orders index jumped 9.2 points to the highest level since March and the production index rose 5.9 points to its highest since July. Employment also rose by 2.9 points and gained back most of the September decline. During the last ten years there has been a 75% correlation between the level of the employment index and the three month change in factory sector employment.
The index of prices paid added another 3.3 points to the 13.4 point spike in September. During the last ten years there has been an 86% correlation between the Chicago price index and the three month change in the "core" intermediate goods PPI.
| Chicago Purchasing Managers Index, SA | Oct | Sept | Oct '04 | 2004 | 2003 | 2002 |
|---|---|---|---|---|---|---|
| Business Barometer | 62.9 | 60.5 | 67.7 | 62.9 | 54.6 | 52.8 |
| New Orders | 72.6 | 63.4 | 79.7 | 67.0 | 58.0 | 56.2 |
| Prices Paid | 79.6 | 76.3 | 84.7 | 80.1 | 55.8 | 56.9 |
by Louise Curley October 31, 2005
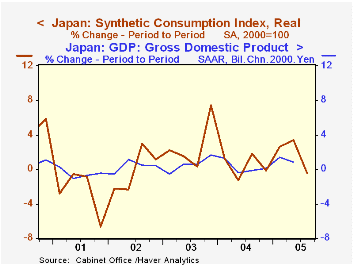
Japan's third quarter growth in Gross Domestic Product is likely to decline and could even be slightly negative according to the Cabinet Office of Japan 's monthly Synthetic Indexes. The monthly synthetic indexes, which cover consumption, business investment, housing investment, public investment, exports and import are based on a multitude of monthly demand and supply related data. They are reported on a nominal and real basis.
The real synthetic consumption index declined 2.7% in September and for the quarter was 0.46% below the second quarter. Since consumption is the largest component of GDP, the decline in the synthetic indicator by itself suggests lower growth in total GDP. The first chart shows the quarter-to-quarter changes in the synthetic consumption index and the quarter-to-quarter changes in total GDP. Although the growth in the synthetic consumption index is more volatile than that of GDP, it is a relatively good predictor of the trend in GDP growth.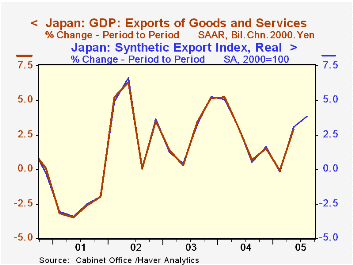
The synthetic business investment index was not available for September, but the data for July and August suggest little growth in this sector in the third quarter. The synthetic housing index showed strength throughout the quarter and was up 0.79% compared with a decline of 1.73% in the second quarter, and a decline of 1.28% in the first. The public investment synthetic index also showed improvement in the third quarter after declines in the first and second quarters. The synthetic indexes for exports and imports, which by the way, track the growth in the GDP components of exports and imports of goods and services almost perfectly (See the second chart, which shows the relationship for exports.), suggest that the increased contribution to growth from the export sector has been counteracted by a sharp increase in imports due largely to petroleum imports.
| Japanese Synthetic Indexes of GDP Components & GDP (Percent Change Period to Period) |
Sep 05 | Aug 05 | Jul 05 | Q3 05 | Q2 05 | Q1 05 | 2004 | 2003 | 2002 |
|---|---|---|---|---|---|---|---|---|---|
| Consumption | -2.69 | 4.81 | -2.98 | -0.46 | 3.39 | 2.59 | 7.29 | 7.40 | -7.67 |
| Business Investment | n.a, | 0.44 | -0.55 | 0.65 | 1.05 | 1.75 | 0.36 | 0.93 | |
| Housing Investment | 0.42 | 1.21 | 0.62 | 0.79 | -1.73 | -1.28 | 1.87 | -1.53 | -4.68 |
| Public Investment | 0.25 | 0.07 | 0.77 | 1.50 | -1.31 | -0.06 | -13.46 | -10.51 | -4.23 |
| Exports | 0.50 | 3.56 | -0.20 | 3.85 | 3.06 | -0.20 | 14.40 | 9.12 | 7.16 |
| Imports | -3.11 | 8.52 | -3.39 | 3.42 | 1.65 | 0.69 | 8.84 | 3.82 | 1.35 |
| Gross Domestic Product | 0.81 | 1.41 | |||||||
| Consumption | 0.60 | 1.21 | |||||||
| Exports of Goods & Services | 2.90 | -0.08 |

Tom Moeller
AuthorMore in Author Profile »Prior to joining Haver Analytics in 2000, Mr. Moeller worked as the Economist at Chancellor Capital Management from 1985 to 1999. There, he developed comprehensive economic forecasts and interpreted economic data for equity and fixed income portfolio managers. Also at Chancellor, Mr. Moeller worked as an equity analyst and was responsible for researching and rating companies in the economically sensitive automobile and housing industries for investment in Chancellor’s equity portfolio. Prior to joining Chancellor, Mr. Moeller was an Economist at Citibank from 1979 to 1984. He also analyzed pricing behavior in the metals industry for the Council on Wage and Price Stability in Washington, D.C. In 1999, Mr. Moeller received the award for most accurate forecast from the Forecasters' Club of New York. From 1990 to 1992 he was President of the New York Association for Business Economists. Mr. Moeller earned an M.B.A. in Finance from Fordham University, where he graduated in 1987. He holds a Bachelor of Arts in Economics from George Washington University.
More Economy in Brief


