 Global| Oct 01 2009
U.S. Personal Income GrowsModestly; PCE Raised By "Cash-for-Clunkers"
by:Tom Moeller
|in:Economy in Brief
Summary
Personal income in August continued to increase at its modest July rate. The 0.2% rise followed a 0.2% gain which was revised from 0.1%. Consensus forecasts were for a 0.1% uptick. These weak increases wholly reflect the current [...]
 Personal
income in August continued to increase at its modest July
rate. The 0.2% rise followed a 0.2% gain which was revised
from 0.1%. Consensus forecasts were for a 0.1% uptick. These weak
increases wholly reflect the current recession. Year-to-year income
growth fell 2.6% during the last twelve months after a 2.9% increase
last year.
Personal
income in August continued to increase at its modest July
rate. The 0.2% rise followed a 0.2% gain which was revised
from 0.1%. Consensus forecasts were for a 0.1% uptick. These weak
increases wholly reflect the current recession. Year-to-year income
growth fell 2.6% during the last twelve months after a 2.9% increase
last year.
The dismal job market accounts for this year's negative income growth. Wages & salaries rose modestly m/m during July and August. However, these latest gains were not enough to lift wages yr-to-yr which fell 5.2% after a 2.1% 2008 increase. Wages in the factory sector fell 11.6% y/y while service sector wages fell 5.4%. To a limited extent these declines were offset by a 3.6% increase in government sector earnings.
Unemployment insurance payments picked up just some of the slack in the job market and rose 4.4% during August. That lifted payments to $136.9B versus $60.4B during August of last year. Interest income continued to show the effects of lower rates and fell 6.9% y/y while dividend income fell by one-quarter as corporate profits dried up.
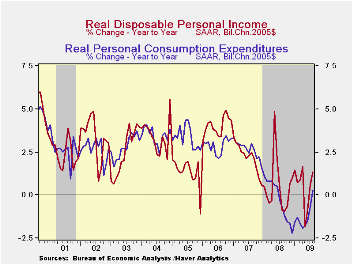
 Disposable
personal
income increased just 0.1% following a slight decline during
July. Adjusted for inflation, real disposable income slipped for the
third straight month, although only by 0.2% during August and by 0.1%
in July. Real disposable income growth of 1.3% y/y was lifted by tax
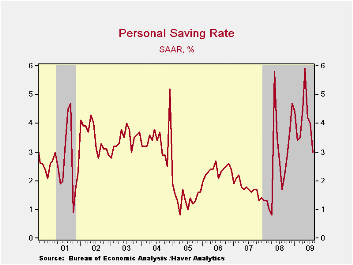
cuts earlier this year. The saving rate fell again with the weakness in
income growth. The decline to 3.0% contrasted with a May peak of 5.9%.
Nevertheless, the rate remained up slightly from last year and double
the 2007 level.
Disposable
personal
income increased just 0.1% following a slight decline during
July. Adjusted for inflation, real disposable income slipped for the
third straight month, although only by 0.2% during August and by 0.1%
in July. Real disposable income growth of 1.3% y/y was lifted by tax
cuts earlier this year. The saving rate fell again with the weakness in
income growth. The decline to 3.0% contrasted with a May peak of 5.9%.
Nevertheless, the rate remained up slightly from last year and double
the 2007 level.
Personal spending showed the full
effect of the "cash-for-clunkers" program for new motor vehicle
purchases. It lifted durables spending by 5.3% (-1.3% y/y) with a 13.3%
gain (6.6% y/y) for autos. Spending on nondurables rose just 2.3%
(-5.3% y/y) as outlays on apparel continued down by 3.8% versus last
year. Spending on furniture continued quite weak and fell 7.7% versus
last year. 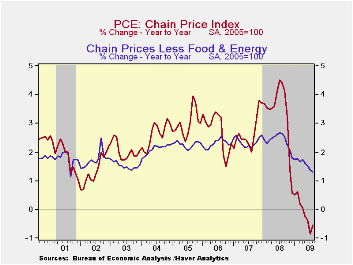 Outlays on services increased 0.4% (1.7% y/y) as spending on
health care continued quite strong and posted a 5.2% gain versus last
year. Spending in restaurants and on recreation remained negative.
Outlays on services increased 0.4% (1.7% y/y) as spending on
health care continued quite strong and posted a 5.2% gain versus last
year. Spending in restaurants and on recreation remained negative.
Prices increased 0.3% during August reflecting an 8.4% rise (-30.5% y/y) in gasoline costs and another rise is in store for September. Nevertheless, the PCE chain price index still was down by 0.5% versus last year. Less food-and-energy, "core" prices were again quite tame and posted their fourth consecutive 0.1% increase. Goods prices rose 0.7% (-3.6% y/y while prices for services increased just 1.0% y/y.
The personal income & consumption figures are available in Haver's USECON and USNA databases.
Yesterday's speech titled Central Bank Exit Policies by Vice Chairman Donald L. Kohn can be found here.
| Disposition of Personal Income (%) | August | July | June | Y/Y | 2008 | 2007 |
|---|---|---|---|---|---|---|
| Personal Income | 0.2 | 0.2 | -1.1 | -2.6 | 2.9 | 5.6 |
| Disposable Personal Income | 0.1 | -0.0 | -1.1 | 0.8 | 3.9 | 4.9 |
| Personal Consumption Expenditures | 1.3 | 0.3 | 0.7 | -0.3 | 3.1 | 5.4 |
| Saving Rate | 3.0 | 4.0 | 4.2 | 1.7 (Aug. '08) | 2.6 | 1.7 |
| PCE Chain Price Index | 0.3 | 0.0 | 0.5 | -0.5 | 3.3 | 2.7 |
| Less food & energy | 0.1 | 0.1 | 0.1 | 1.3 | 2.4 | 2.4 |
Japan's Tankan Shows Up-Swing... And Less
by Robert Brusca October 01, 2009
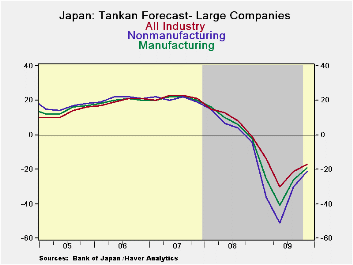
Yes, Japan’s Tankan survey has legs and the rise in the
various large company Tankan indices is ongoing. There is somewhat less
vigor in the rise of the future improvement expected but it is still
advancing at a solid pace and the current situation has improved more
rapidly. The fly in the ointment this quarter is that despite ‘improved
confidence’ the plans for capital expenditure have been cut back. In
the end that casts some doubt about the rise in confidence itself.
Firms with profits still under pressure are acting to conserve cash
instead of aggressively re-deploying themselves for growth ahead. That
kind of behavior could help to torpedo recovery even as survey
respondents say that things are getting better.
The table above shows that manufacturing, wholesaling and personal
services are best sectors in terms of the percentile standing of their
respective indices. Even so these sectors are in the bottom 30th
percentile of their respective ranges or lower. Non MFG as a whole is
in the bottom 13 percentile of its range. Manufacturing’s outlook, at a
raw reading of -21, is in the 41st percentile of its range. That is
somewhat better, than the current assessment but still far from good.
Medium sized firms assess their MFG index as in the 23rd percentile of
its ranges for small enterprises it is much worse as they stand in the
bottom 7th percentile of their range. The nonMFG percentiles for the
medium and small enterprises are comparable to the Tankan Large Company
readings for Non MFG – very weak.
Yes Japan has made progress. But the current state of business is still
poor even though it has improved. While the expected improvement is at
a slightly better level than the assessment of current conditions,
firms continue to react to the recession instead of planning ahead for
recovery. As a result, one of the great forces of recovery has yet to
be unleashed- optimism. Japan’s recovery remains cautiously guarded and
in the end that will be a drag on its momentum. Until firms see the
need to invest for the future and as long as they cut and hack at
existing spending plans the look will remain touch and go.
| Tankan Results Large Enterprises | |||||||
|---|---|---|---|---|---|---|---|
| Readings | Averages | PERCENTILES | |||||
| Q3-09 | Q2-09 | Q1-09 | Q4-08 | 1-Y Avg | Since Q3'03 | Since Q1'04 | |
| MFG | -33.0 | -48.0 | -58.0 | -24.0 | -40.5 | 5.3 | 29.8% |
| NonMFG | -24.0 | -29.0 | -31.0 | -9.0 | -26.5 | 7.8 | 13.2% |
| Total Industry | -28.0 | -39.0 | -45.0 | -16.0 | -33.5 | 6.5 | 25.0% |
| Construction | -23.0 | -29.0 | -27.0 | -10.0 | -26.0 | -5.9 | 18.2% |
| Real Estate | -11.0 | -24.0 | -21.0 | -7.0 | -17.5 | 24.3 | 16.9% |
| Wholesale | -29.0 | -41.0 | -44.0 | -7.0 | -35.0 | 8.2 | 22.1% |
| Retail | -32.0 | -39.0 | -42.0 | -18.0 | -35.5 | -0.9 | 17.2% |
| Transportation | -35.0 | -43.0 | -46.0 | -7.0 | -39.0 | 5.8 | 15.7% |
| Services 4 Biz | -22.0 | -30.0 | -21.0 | -1.0 | -26.0 | 15.2 | 11.9% |
| Personal Serv | -4.0 | -11.0 | -9.0 | -11.0 | -7.5 | 7.1 | 23.3% |
| Restaurants & Hotels | -50.0 | -46.0 | -45.0 | -32.0 | -48.0 | -3.3 | 0.0% |
| Forecast | |||||||
| Q4-09 | Q3-09 | Q2-09 | Q1-09 | 1-Y Avg | Since Q3'03 | Since Q1'04 | |
| MFG-OtLk | -21.0 | -30.0 | -51.0 | -36.0 | -34.5 | 5.8 | 41.1% |
| NonMFG -Otlk | -17.0 | -21.0 | -30.0 | -14.0 | -20.5 | 8.4 | 24.5% |
| All Industry-Otlk | -19.0 | -26.0 | -41.0 | -25.0 | -27.8 | 7.0 | 34.9% |
| Tankan Results Medium Enterprises | |||||||
| Q3-09 | Q2-09 | Q1-09 | 1-Y Avg | 1-Y Avg | Since Q3'03 | Since Q1'04 | |
| MFG | -40.0 | -55.0 | -57.0 | -44.0 | -44.0 | -7.8 | 23.0% |
| NonMFG | -30.0 | -36.0 | -37.0 | -31.0 | -31.0 | -8.9 | 15.6% |
| Forecast | |||||||
| Q4-09 | Q3-09 | Q2-09 | Q1-09 | 1-Y Avg | Since Q3'03 | Since Q1'04 | |
| MFG-OtLk | -35.0 | -46.0 | -61.0 | -45.0 | -46.8 | -9.1 | 34.7% |
| NonMFG -Otlk | -28.0 | -32.0 | -45.0 | -32.0 | -34.3 | -10.5 | 32.7% |
| All Industry-Otlk | -31.0 | -39.0 | -51.0 | -38.0 | -39.8 | -10.1 | 32.8% |
| Tankan Results Small Enterprises | |||||||
| Q4-09 | Q3-09 | Q2-09 | Q1-09 | 1-Y Avg | Since Q3'03 | Since Q1'04 | |
| MFG | -52.0 | -57.0 | -57.0 | -54.5 | -54.5 | -15.0 | 7.5% |
| NonMFG | -39.0 | -44.0 | -42.0 | -41.5 | -41.5 | -20.2 | 13.2% |
| Total Industry | -39.0 | -44.0 | -42.0 | -41.5 | -41.5 | -20.2 | 12.2% |
| Forecast | |||||||
| Q4-09 | Q3-09 | Q2-09 | Q1-09 | 1-Y Avg | Since Q3'03 | Since Q1'04 | |
| MFG-OtLk | -44.0 | -53.0 | -63.0 | -48.0 | -52.0 | -16.2 | 26.4% |
| NonMFG -Otlk | -40.0 | -45.0 | -52.0 | -42.0 | -44.8 | -23.9 | 27.3% |
| All Industry-Otlk | -41.0 | -48.0 | -56.0 | -44.0 | -47.3 | -21.1 | 27.8% |
U.S. Pending Home Sales Climb Another 6.4% in August
by Carol Stone October 1, 2009
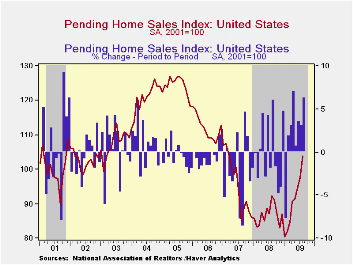 Housing
demand continues to improve. The National Association of Realtors (NAR)
reported that during August, pending home sales increased 6.4%, notably
stronger than June's 3.6% and July's 3.2% gains. NAR's index
stood at 103.8, the highest since March 2007; the index base is
2001=100.
Housing
demand continues to improve. The National Association of Realtors (NAR)
reported that during August, pending home sales increased 6.4%, notably
stronger than June's 3.6% and July's 3.2% gains. NAR's index
stood at 103.8, the highest since March 2007; the index base is
2001=100.
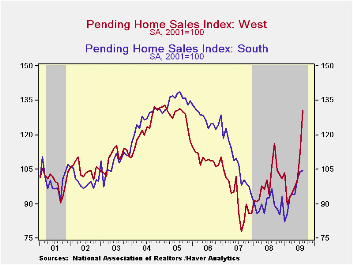
In this report, all four regions of the
country participated in the firming sales pattern. The West
led again, with a whopping 16.0% jump. This is a
monthly rate; you can annualize it, if you like, and see a really
eye-popping figure. The sales index there was 130.5; its
all-time high in the West is 133.0 in February 2005.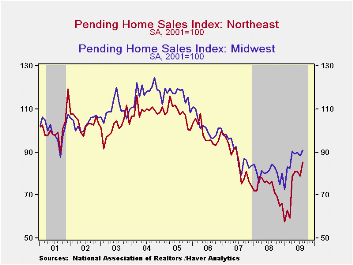 This
upturn in sales has been helped by weak house prices, but as noted
elsewhere on these pages recently, these prices have started to firm;
while there are no price data with this report, NAR's tally of sales
closed in August showed an outright increase in prices in the West of
1.3%; since an apparent trough in April, these prices have risen a
total of 8.6%.
This
upturn in sales has been helped by weak house prices, but as noted
elsewhere on these pages recently, these prices have started to firm;
while there are no price data with this report, NAR's tally of sales
closed in August showed an outright increase in prices in the West of
1.3%; since an apparent trough in April, these prices have risen a
total of 8.6%.
Elsewhere, sales advanced 8.2% in the Northeast, and at 85.3, this index is up 47.6% since the low there in January. In the Midwest, sales gained 3.1% in August, and they are 25.1% above their low, also in January. Sales in the South just barely edged higher, 0.8%, but they have risen more in prior months, so that they are now 27.3% above their January trough.
 These
home sales figures are analogous to the new home sales data from the
Commerce Department in that they measure existing home sales when the
sales contract is signed, not at the time the sale is closed. The
series dates back to 2001.
These
home sales figures are analogous to the new home sales data from the
Commerce Department in that they measure existing home sales when the
sales contract is signed, not at the time the sale is closed. The
series dates back to 2001.
The pending home sales data are available in Haver's PREALTOR database. The number of homes on the market and prices are in the REALTOR database.
| Pending Home Sales (2001=100) | August | July | June | Y/Y | 2008 | 2007 | 2006 |
|---|---|---|---|---|---|---|---|
| Total | 103.8 | 97.6 | 94.6 | 12.3% | 86.8 | 95.8 | 112.1 |
| Northeast | 85.3 | 78.8 | 81.2 | 11.9 | 73.1 | 85.9 | 98.9 |
| Midwest | 90.8 | 88.1 | 89.9 | 7.6 | 80.6 | 89.5 | 101.9 |
| South | 104.6 | 103.8 | 100.7 | 8.3 | 89.6 | 107.3 | 127.2 |
| West | 130.5 | 112.5 | 100.4 | 22.3 | 99.5 | 92.3 | 109.6 |
ISM Factory Index Remains Near Highest Level Since Early-2007 Suggesting Positive Growth
by Tom Moeller October 1, 2009
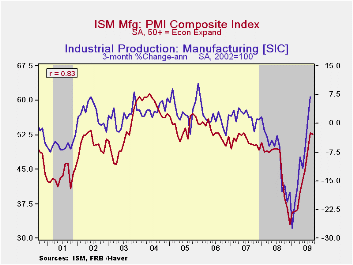 The National
Association of Purchasing Management data continued to indicate that
the recession in U.S. factory sector activity is over. Though the
September composite index slipped to 52.6 from 52.9 in August, it
remained near the highest level since June of 2007. (Any reading above
the break-even point of 50 suggests rising activity.) The latest figure
was up from the low of 32.9 hit last December but it fell short of
Consensus expectations for a reading of 54.0. The ISM data is available
in Haver's USECON database.
The National
Association of Purchasing Management data continued to indicate that
the recession in U.S. factory sector activity is over. Though the
September composite index slipped to 52.6 from 52.9 in August, it
remained near the highest level since June of 2007. (Any reading above
the break-even point of 50 suggests rising activity.) The latest figure
was up from the low of 32.9 hit last December but it fell short of
Consensus expectations for a reading of 54.0. The ISM data is available
in Haver's USECON database.
A sharp decline in
the production component to a still firm 55.7 accounted for much of the
latest decline. During the last ten years there has been an 84%
correlation between the level of the production component of the
composite index and the three-month growth in factory sector industrial
production. 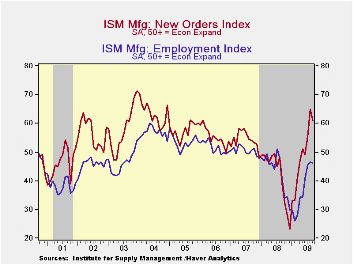 It is appropriate to correlate the ISM index level
with factory sector output growth because the ISM
index is a diffusion index. It measures growth by using all of the
positive changes in activity added to one half of the zero change in
activity measures. The new orders component fell
just modestly. On the up side, the export order index at 55.0 was near
the highest in over a year, suggesting that recessions abroad are
winding down. During the last ten years there has been a 53%
correlation between the index and the q/q change in real exports of
goods in the GDP accounts.
It is appropriate to correlate the ISM index level
with factory sector output growth because the ISM
index is a diffusion index. It measures growth by using all of the
positive changes in activity added to one half of the zero change in
activity measures. The new orders component fell
just modestly. On the up side, the export order index at 55.0 was near
the highest in over a year, suggesting that recessions abroad are
winding down. During the last ten years there has been a 53%
correlation between the index and the q/q change in real exports of
goods in the GDP accounts.
The employment index also fell just slightly. Though the 46.2 reading continued to suggest a lower level of hiring, the index was near its highest level since last August and was up from the February low of 26.1. During the last ten years there has been a 90% correlation between the index level and the three-month change in manufacturing payrolls.
 A reduced
rate of inventory
liquidation seems to be behind the factory sector's recent improvement.
The inventory index jumped to 42.5 which was its highest level since
last October. The speed of supplier deliveries also points toward
improvement in activity. Slower delivery speeds are indicated by a rise
in the index to its highest level since 2005 (no typo).
A reduced
rate of inventory
liquidation seems to be behind the factory sector's recent improvement.
The inventory index jumped to 42.5 which was its highest level since
last October. The speed of supplier deliveries also points toward
improvement in activity. Slower delivery speeds are indicated by a rise
in the index to its highest level since 2005 (no typo).
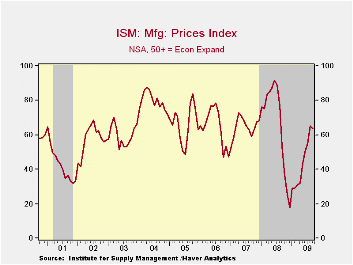
The separate index of prices paid also suggests improved factory sector activity. At 63.5, the reading was near its highest level since last August and it's up from the December low of 18.0. During the last twenty years there has been a 79% correlation between the price index and the three-month change in the PPI for intermediate goods.
| ISM Mfg | September | August | September '08 | 2008 | 2007 | 2006 |
|---|---|---|---|---|---|---|
| Composite Index | 52.6 | 52.9 | 43.4 | 45.5 | 51.1 | 53.1 |
| New Orders Index | 60.8 | 64.9 | 39.2 | 42.1 | 54.3 | 55.4 |
| Employment Index | 46.2 | 46.4 | 40.9 | 43.2 | 50.5 | 51.7 |
| Prices Paid Index (NSA) | 63.5 | 65.0 | 53.5 | 66.5 | 64.6 | 65.0 |
U.S. Weekly Claims For Jobless Insurance Tick Higher
by Tom Moeller October 1, 2009
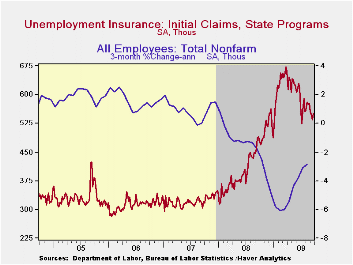
Initial claims for jobless insurance ticked higher last week and suggested little labor market improvement since the summer. The Labor Department indicated that claims reversed the prior week's decline and rose 17,000 to 551,000, the highest since July. Nevertheless the latest was own from the March weekly peak of 674,000. The latest increase contrasted with expectations for 535,000 claims.
The largest increases in initial claims for the week ending
September 19 were in California (+5,112), Texas (+3,946), Florida
(+2,348), Iowa (+2,013), and Illinois (+1,945), while the largest
decreases were in Kansas (-1,545), Wisconsin (-1,258), Oregon (-833),
Ohio (-804), and New York (-623).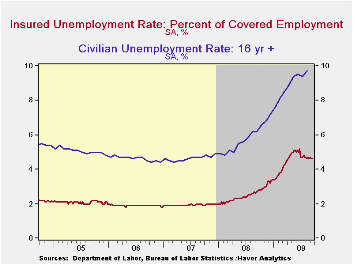
Continuing claims for unemployment insurance during the latest week fell 70,000 to their lowest level since April. The decline owes partially to the exhaustion of benefits. Continuing claims provide an indication of workers' ability to find employment. The four-week average of continuing claims fell modestly to 6,154,500. The series dates back to 1966.
Extended benefits for unemployment insurance rose for the third consecutive week. Through mid-September extended benefits averaged 440,716.
The insured rate of unemployment held at 4.6% and was near the lowest level since mid-April. The rate reached a high of 5.2% during late-June. During the last ten years, there has been a 93% correlation between the level of the insured unemployment rate and the overall rate of unemployment published by the Bureau of Labor Statistics.
The highest insured unemployment rates in the week ending September 12 were in Puerto Rico (6.1 percent), Oregon (5.4), Nevada (5.3), Pennsylvania (5.3), California (4.9), Michigan (4.9), Wisconsin (4.8), New Jersey (4.7), North Carolina (4.7), Arkansas (4.6), and South Carolina (4.6).
The unemployment insurance claims data is available in Haver's WEEKLY database and the state data is in the REGIONW database.
| Unemployment Insurance (000s) | 09/26/09 | 09/19/09 | 09/12/09 | Y/Y | 2008 | 2007 | 2006 |
|---|---|---|---|---|---|---|---|
| Initial Claims | 551 | 534 | 550 | 12.4% | 420 | 321 | 313 |
| Continuing Claims | -- | 6,090 | 6,160 | 67.4% | 3,342 | 2,552 | 2,459 |
| Insured Unemployment Rate (%) | -- | 4.6 | 4.6 | 2.7 (09/2008) | 2.5 | 1.9 | 1.9 |
U.S. Construction Spending Gains in August, But June & July Revised Down
by Carol Stone October 1, 2009
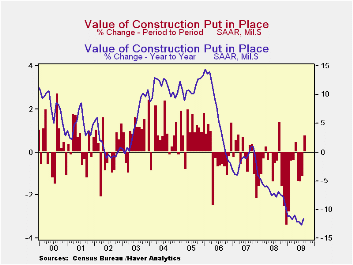 The
headline sounded so promising: construction spending rose
0.8% in August, when forecasters had looked only for a 0.2% decrease.
But the pleasure with this result was short-lived. July's amount was
revised from -0.2% to -1.1% and June's from a marginal 0.1% increase to
a 1.4% fall. Some parts of the economy are improving, but much of
construction activity continues to lag. Total outlays in August were
11.6% below a year ago.
The
headline sounded so promising: construction spending rose
0.8% in August, when forecasters had looked only for a 0.2% decrease.
But the pleasure with this result was short-lived. July's amount was
revised from -0.2% to -1.1% and June's from a marginal 0.1% increase to
a 1.4% fall. Some parts of the economy are improving, but much of
construction activity continues to lag. Total outlays in August were
11.6% below a year ago.
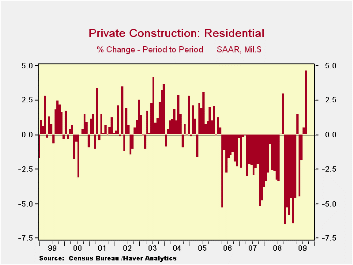
Nonresidential projects remain the weakest. Those outlays
edged down 0.1% in August, and July was revised from -1.2% to -2.6%,
while June's figure was cut back from -2.2% to -4.0%.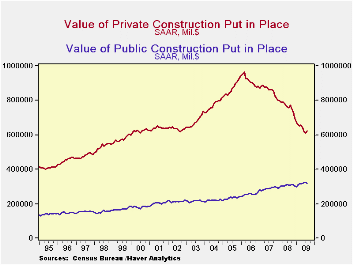 Over these last 3
months combined, nonresidential outlays dropped by 6.5%; the weakest
segments have been lodging, commercial and amusements, each down
12-15%; education (private structures), offices, transportation,
manufacturing and communication, down 5-8%, and health care, power and
religious construction activity have been flat to somewhat higher.
However, as Tom Moeller pointed out here a month ago, these declines
result mainly from poor business profits during the worst of the
recession; planning and building lead-times mean that recent work
reflects those discouraging business conditions from at least several
months ago or more. Now profits are improving and recovery in the
residential sector seems to be more firmly established. So the
implications for sustained turnaround in nonresidential construction
are much more positive now.
Over these last 3
months combined, nonresidential outlays dropped by 6.5%; the weakest
segments have been lodging, commercial and amusements, each down
12-15%; education (private structures), offices, transportation,
manufacturing and communication, down 5-8%, and health care, power and
religious construction activity have been flat to somewhat higher.
However, as Tom Moeller pointed out here a month ago, these declines
result mainly from poor business profits during the worst of the
recession; planning and building lead-times mean that recent work
reflects those discouraging business conditions from at least several
months ago or more. Now profits are improving and recovery in the
residential sector seems to be more firmly established. So the
implications for sustained turnaround in nonresidential construction
are much more positive now.
Public construction was down in August by 1.1%, as federal building activity fell 7.6%, while state and local government outlays decreased 0.5%. Increases over previous months mean that the year-on-year comparison still shows a gain, this of 3.3%.
| Construction (%) | August | July | June | Y/Y | 2008 | 2007 | 2006 |
|---|---|---|---|---|---|---|---|
| Total | 0.8 | -1.1 | -1.4 | -11.6 | -6.9 | -1.6 | 6.3 |
| Private | 1.8 | -1.4 | -3.2 | -17.8 | -11.1 | -5.7 | 5.5 |
| Residential | 4.7 | 0.6 | -1.8 | -26.7 | -29.1 | -19.7 | 1.0 |
| Nonresidential | -0.1 | -2.6 | -4.0 | -10.5 | 13.2 | 23.1 | 16.2 |
| Public | -1.1 | -0.7 | 2.2 | 3.3 | 5.6 | 13.1 | 9.3 |

Tom Moeller
AuthorMore in Author Profile »Prior to joining Haver Analytics in 2000, Mr. Moeller worked as the Economist at Chancellor Capital Management from 1985 to 1999. There, he developed comprehensive economic forecasts and interpreted economic data for equity and fixed income portfolio managers. Also at Chancellor, Mr. Moeller worked as an equity analyst and was responsible for researching and rating companies in the economically sensitive automobile and housing industries for investment in Chancellor’s equity portfolio. Prior to joining Chancellor, Mr. Moeller was an Economist at Citibank from 1979 to 1984. He also analyzed pricing behavior in the metals industry for the Council on Wage and Price Stability in Washington, D.C. In 1999, Mr. Moeller received the award for most accurate forecast from the Forecasters' Club of New York. From 1990 to 1992 he was President of the New York Association for Business Economists. Mr. Moeller earned an M.B.A. in Finance from Fordham University, where he graduated in 1987. He holds a Bachelor of Arts in Economics from George Washington University.
More Economy in Brief


