 Global| Feb 28 2005
U.S. Personal Income Down
by:Tom Moeller
|in:Economy in Brief
Summary
Personal income dropped last month 2.3% following the 3.7% jump in December which was driven by Microsoft's dividend payment. Consensus expectations had been for a 2.6% decline. Excluding the dividend effect personal income increased [...]
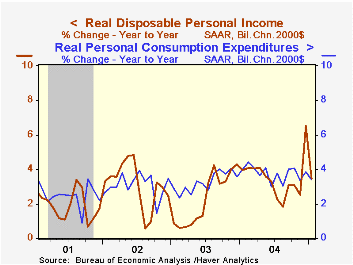
Personal income dropped last month 2.3% following the 3.7% jump in December which was driven by Microsoft's dividend payment. Consensus expectations had been for a 2.6% decline. Excluding the dividend effect personal income increased 0.5% last month after a 0.6% rise in December. Figures from July through December were revised
Wage & salary income rose 0.6% (5.8% y/y) in January after an upwardly revised 0.5% December gain. Factory sector wages inched 0.1% higher but rose 4.8% y/y. Earlier figures were revised up sharply
Personal disposable income fell 2.6% (5.8% y/y) after the 4.1% surge in December. Adjusted for price inflation disposable income fell 2.8% m/m but rose 3.5% y/y.
Personal consumption fell slightly after the 0.8% surge in December and spending was lightly short of Consensus expectations for a 0.1% rise. Durable goods spending fell 4.3% and reversed a like gain in December due to lower motor vehicle sales. Spending on nondurables rose 0.8% despite the decline in gasoline prices last month and services spending rose 0.4% (5.3% y/y).
The PCE chain price index rose 0.2% in January. The 0.3% rise in the price index less food & energy was the steepest since December 2002.
| Disposition of Personal Income | Jan | Dec | Y/Y | 2004 | 2003 | 2002 |
|---|---|---|---|---|---|---|
| Personal Income | -2.3% | 3.7% | 6.0% | 5.6% | 3.2% | 1.8% |
| Personal Consumption | -0.0% | 0.8% | 5.7% | 6.0% | 5.2% | 4.6% |
| Savings Rate | 1.0% | 3.6% | 1.1% | 1.2% | 1.4% | 2.0% |
| PCE Chain Price Index | 0.2% | -0.0% | 2.2% | 2.2% | 1.9% | 1.4% |
| Less food & energy | 0.3% | 0.0% | 1.6% | 1.5% | 1.3% | 1.8% |
by Tom Moeller February 28, 2005
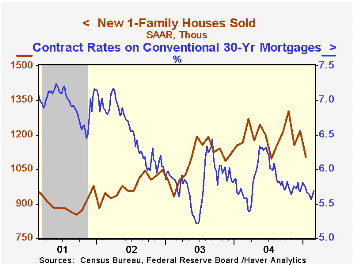
Sales of new single-family homes fell a sharp 9.2% in January to 1.106M but the previously reported slight gain in December was revised to a 5.6% increase. Consensus estimates had been for sales of 1.125M.
The decline in sales last month was led by a 40.3% drop in the Midwest (-33.2% y/y). In the Northeast sales fell 17.1% (-33.7% y/y) and in the South sales also fell by 3.3% (+1.3% y/y). In the West sales rose 5.6% in January (+16.6% y/y).
The median price of a new single family home fell to $199,400 (-4.8% y/y).
The figures from the Census Department reflect homes sold as opposed to the figures on existing home sales from the National Association of Realtors which reflect closings of sales in earlier months.
| Homes Sales (000s, AR) | Jan | Dec | Y/Y | 2004 | 2003 | 2002 |
|---|---|---|---|---|---|---|
| New Single-Family | 1,106 | 1,218 | -4.2% | 1,196 | 1,089 | 976 |
by Tom Moeller February 28, 2005
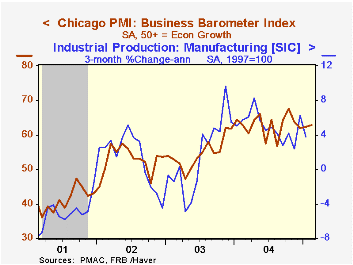
The Chicago Purchasing Managers Business Barometer rose for the second month and increased to 62.7 in February, beating Consensus expectations for a decline to 60.2.
During the last ten years there has been a 67% correlation between the level of the Chicago Business Barometer and the three month change in factory sector industrial output. That correlation has risen to 82% during the last five years.
The employment index surged 4.9 points to 57.7, the highest level since November. During the last ten years there has been a 78% correlation between the level of the employment index and the three month change in factory sector employment. The new orders index rose to the highest level since October.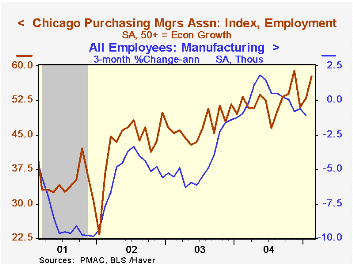
The index of prices paid fell sharply to the lowest level in nearly a year. During the last ten years there has been an 86% correlation between the Chicago price index and the three month change in the "core" intermediate goods PPI.
| Chicago Purchasing Managers Index, SA | Feb | Jan | Feb '04 | 2004 | 2003 | 2002 |
|---|---|---|---|---|---|---|
| Business Barometer | 62.7 | 62.4 | 64.7 | 62.9 | 54.6 | 52.8 |
| New Orders | 68.5 | 65.8 | 66.4 | 67.0 | 58.0 | 56.2 |
| Prices Paid | 70.1 | 76.5 | 67.7 | 80.1 | 55.8 | 56.9 |

Tom Moeller
AuthorMore in Author Profile »Prior to joining Haver Analytics in 2000, Mr. Moeller worked as the Economist at Chancellor Capital Management from 1985 to 1999. There, he developed comprehensive economic forecasts and interpreted economic data for equity and fixed income portfolio managers. Also at Chancellor, Mr. Moeller worked as an equity analyst and was responsible for researching and rating companies in the economically sensitive automobile and housing industries for investment in Chancellor’s equity portfolio. Prior to joining Chancellor, Mr. Moeller was an Economist at Citibank from 1979 to 1984. He also analyzed pricing behavior in the metals industry for the Council on Wage and Price Stability in Washington, D.C. In 1999, Mr. Moeller received the award for most accurate forecast from the Forecasters' Club of New York. From 1990 to 1992 he was President of the New York Association for Business Economists. Mr. Moeller earned an M.B.A. in Finance from Fordham University, where he graduated in 1987. He holds a Bachelor of Arts in Economics from George Washington University.
More Economy in Brief


