 Global| Jul 31 2007
U.S. Personal Income About On Forecast, Core Prices Again Up 0.1%
by:Tom Moeller
|in:Economy in Brief
Summary
Personal income rose 0.4% last month, the same as during May. The June increase about matched Consensus expectations for a 0.5% gain. The June increase at 6.1% y/y left income growing near the rate of increase during the last three [...]
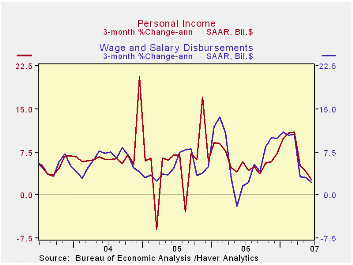
Personal income rose 0.4% last month, the same as during May. The June increase about matched Consensus expectations for a 0.5% gain. The June increase at 6.1% y/y left income growing near the rate of increase during the last three years.
The report of a 0.1% increase in the PCE chain price index during June brought with it a 0.1% rise in the core PCE price measure, the fourth 0.1% increase in a row. It was slightly below expectations for a 0.2% gain. annualized, the gain in core prices came in at 1.6% over the last three months. The increase in the total PCE price index was 3.8% during the same three months (AR): down from the 5.0% three month gain during May. 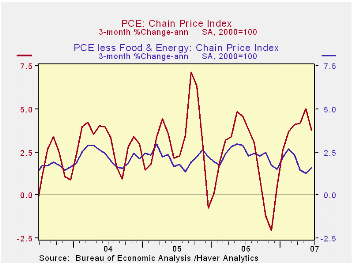
Wages & salaries increased 0.5% (6.7% y/y) and factory sector wages rose the same 0.5% (5.6% y/y) after a 0.1% May rise.Wage & salary income in service producing industries rose 0.6% (7.4% y/y) after a 0.5% increase in May while pay in the government sector rose 0.4% (5.0% y/y).
Interest income ticked up 0.1% (1.1% y/y) for the third consecutive month while dividend income rose 1.0% (14.2% y/y), about the same as during the prior six months.
Personal current taxes increased 0.7% (10.7% y/y). That left disposable personal income to grow 0.4% (5.5% y/y) after a 0.4% May gain. Real disposable personal income thus rose 0.3% (3.1% y/y) last month after a 0.1% decline during May.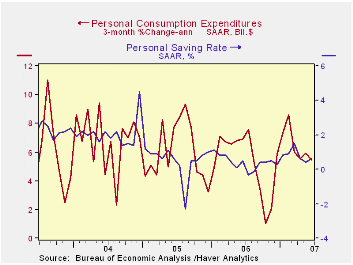
Personal consumption expenditures increased just 0.1% in June following a little revised 0.6% gain during May. Expectations were for 0.2% rise. Durable goods purchases reversed all of the prior month’s increase with a 1.6% (+2.6% y/y) decline as spending on motor vehicles fell 2.1% (+2.0% y/y) and spending on furniture & other household equipment fell 1.0% (+2.5 y/y. Lower gasoline prices dropped spending on gasoline by 0.4% (+4.4% y/y) and spending on apparel fell 0.8% (+3.5% y/y). One of the few increases in spending last month was on medical care by 0.5% (6.3% y/y).
The personal saving rate was back in positive territory as earlier upward revisions brought it to 0.6% in June.
| Disposition of Personal Income | June | May | Y/Y | 2006 | 2005 | 2004 |
|---|---|---|---|---|---|---|
| Personal Income | 0.4% | 0.4% | 6.1% | 6.6% | 5.9% | 6.2% |
| Personal Consumption | 0.1% | 0.6% | 5.2% | 5.9% | 6.2% | 6.4% |
| Saving Rate | 0.6% | 0.4% | 0.5% (June 06) | -1.1% | -0.4% | 2.0% |
| PCE Chain Price Index | 0.1% | 0.5% | 2.3% | 2.8% | 2.9% | 2.6% |
| Less food & energy | 0.1% | 0.1% | 1.9% | 2.2% | 2.2% | 2.1% |
by Tom Moeller July 31, 2007
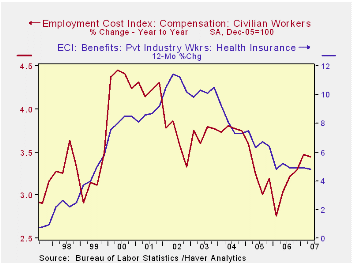
For private industry workers, the employment cost index rose an expected 0.9% last quarter. The gain followed a more modest 0.6% 1Q increase that was held back by a 0.3% decline in benefits costs.
Benefit costs rebounded 1.1% from the prior quarter’s move down. The cost of health benefits increased 4.8% y/y, continuing the slowdown of the last four years.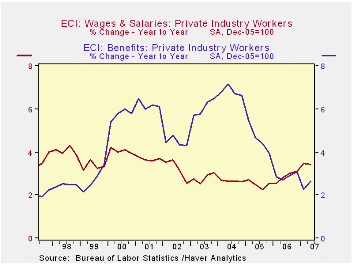
Wage and salary growth at 0.8% was lower than the 1.1% the prior quarter but the y/y growth of 3.4% was near the strongest of the last five years. Wages account for roughly 70% of the compensation index.
| ECI- Private Industry Workers | 2Q | 1Q | Y/Y | 2006 | 2005 | 2004 |
|---|---|---|---|---|---|---|
| Compensation | 0.9% | 0.6% | 3.1% | 2.9% | 3.1% | 3.8% |
| Wages & Salaries | 0.8% | 1.1% | 3.4% | 2.9% | 2.5% | 4.7% |
| Benefit Costs | 1.1% | -0.3% | 2.7% | 2.9% | 4.6% | 6.8% |
by Robert Brusca EU Indices Remain High-valued, but Main Index also Edges Lower, Pace Slows July 31, 2007
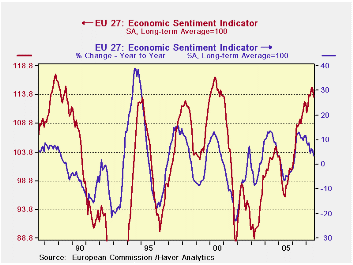
Even as the overall EU index of sentiment stays at a high level, its 12-month change is withering.
The EU retail index is relative the strongest this month as it resides in the top 4 percent of its range (96.3 percentile). The construction and industrial sectors also are in their 9th percentiles. Consumer confidence is lower than that, in the top 14 percent of its range, while the service sector is only in the top one-third of its range. Still, these are firm-to-strong readings.
But main country, Germany, is off for two months running. Italy has a string of declines. Spain is off for only the current month. France continues to show higher readings.
The overall industrial construction and services sectors gave back ground this month. Consumer confidence and retailing held firm.
Overall we must characterize the readings from this month as strong. But we offer the chart at the top as a reminder that once the rate of change begins to slip, this usually it is an authentic sign that the overall index is heading for a peak (this index already has done that) and then for some degree of slowdown.
In past peaking episodes the momentum measure peaked and fell off fairly rapidly. In this episode the loss of momentum is clearly more gradual. In previous cycles, the move from negative to positive back to negative momentum was usually executed more quickly than is the case in this cycle. That slower trajectory into negative momentum is a hopeful indicator. While the EU is sliding to a slower pace of growth, its rate of slowdown will be milder than in past episodes.
| R-SQ w/Confid |
|||||||||||
|---|---|---|---|---|---|---|---|---|---|---|---|
| EU | Jul-07 | Jun-07 | May-07 | Apr-07 | Percentile | Rank | Max | Min | Range | Mean | |
| Overall | 113.3 | 115 | 115 | 113.6 | 91.7 | 18 | 117 | 74 | 43 | 100 | 1.00 |
| Industrial | 5 | 7 | 6 | 6 | 94.1 | 8 | 7 | -27 | 34 | -7 | 0.89 |
| Consumer Confidence | -2 | -2 | -1 | -4 | 86.2 | 18 | 2 | -27 | 29 | -11 | 0.81 |
| Retail | 5 | 5 | 5 | 6 | 96.3 | 2 | 6 | -21 | 27 | -6 | 0.46 |
| Construction | 0 | 1 | 1 | 1 | 93.3 | 13 | 3 | -42 | 45 | -18 | 0.43 |
| Services | 20 | 21 | 23 | 22 | 68.4 | 57 | 32 | -6 | 38 | 17 | 0.80 |
| % m/m | Based on Level | Level | |||||||||
| EMU | -0.6% | -0.4% | 1.0% | -0.1% | 85.4 | 32 | 117 | 74 | 44 | 100 | 0.94 |
| Germany | -0.5% | -0.4% | 0.8% | 1.3% | 76.1 | 18 | 121 | 79 | 42 | 100 | 0.61 |
| France | 0.6% | 0.0% | 3.0% | 0.1% | 87.8 | 17 | 119 | 72 | 47 | 100 | 0.79 |
| Italy | -0.9% | -1.3% | -1.4% | -1.0% | 70.0 | 64 | 121 | 72 | 49 | 100 | 0.80 |
| Spain | -0.9% | 1.2% | -1.2% | -2.2% | 60.1 | 142 | 118 | 67 | 50 | 100 | 0.67 |
| Memo: UK | -5.7% | 1.6% | 3.4% | -0.8% | 80.4 | 48 | 119 | 69 | 50 | 100 | 0.37 |
| Since 1990 except Services (Oct 1996) | 208-Count | Services:126-Count | |||||||||
| Sentiment is an index, sector readings are net balance diffusion measures | |||||||||||
by Robert Brusca July 31, 2007
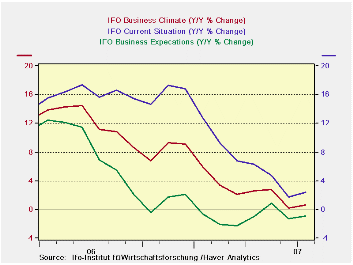
The main IFO gauges show that while the current readings for IFO are still very strong, the current indices are trending lower. As index numbers the index for expectations hit a bit of a ceiling and has formed what is essentially a double top. Expectations rarely get much stronger than an index reading of 105. The accompanying chart shows these indexes as percent changes and the downward slide of momentum is apparent.
Now, as the IFO gauges began to poster lower numbers, we look to see what the detail of the IFO report tells us about that step-back.
In terms of Y/Y percentage changes the current situation index continued to rise. However MFG is now lower Y/Y as it has been for two months running. Not shown in the table below is the detail for wholesaling which has fallen for the second straight month or construction, now off for three months in a row. Retailing is up in July after being off Yr/Yr in June.
Expectations are off across most main sectors with the MFG index off by 0.5% Yr/Yr and off on that basis for five of the past six months. Wholesaling expectations are off for one month in a row; retail is off for three months in a row and for five of the past six months.
Within MFG the overall sector shows a decline in activity Yr/Yr and that decline is seen in intermediate goods and consumer goods but capital goods activity rebounded in July after having made its first Y/Y drop in June.
Assessments of demand for MFG sectors are dropping in most sectors and have been dropping for five months more or less. The exception is the consumer sector where demand is seen as up in July; it was also up in May.
Also in MFG, orders on hand are somewhat mixed. The total is lower Y/r (-2.7%). But that is mostly weakness in intermediate goods since capital goods orders and consumer goods are still growing.
Foreign orders continue to grow, by 1.9% in all of MFG but intermediate orders are off. Foreign capital goods orders are up strongly but are slowing their rate of ascent; consumer goods orders are flat.
The outlook for three months ahead (bottom panel of table) is still mostly positive, but with some mixed trends. MFG export expectations are flat, despite good orders responses above. Orders expectations for retailing are on a long string of declines although the pace of decline is withering. Wholesale orders are positive but their strength is withering. Export expectations for three months ahead have turned flat for manufacturing in July. Employment expectations over the next three months do continue to be upbeat.
The German economy still is emitting a lot of very positive signals. However do not get lost in the high level of the indexes since they are also losing momentum. While retailing seems to be one improving sector its ability to offset slippage elsewhere has not been established.
| Percent: Yr/Yr | INDEX NUMBERS | ||||||||
| Jul-07 | Jun-07 | May-07 | Apr-07 | Mar-07 | CURRENT | Average | Curr/Avg | Percentile | |
| Biz Climate | 0.7% | 0.2% | 2.8% | 2.6% | 2.1% | 106.4 | 95.7 | 111.2% | 90.3% |
| Current Situation | 2.4% | 1.7% | 4.7% | 6.3% | 6.7% | 111.3 | 94.7 | 117.5% | 87.6% |
| Biz Expectations: Next 6-Mos | -0.9% | -1.2% | 0.9% | -0.9% | -2.3% | 101.8 | 96.7 | 105.3% | 82.9% |
| Jul-07 | Jun-07 | May-07 | Apr-07 | Mar-07 | CURRENT | Average | Curr/Avg | Percentile | |
| Current Situation | |||||||||
| MFG | 4.5% | 4.4% | 6.6% | 7.6% | 9.4% | 111.3 | 92.2 | 120.8% | 95.3% |
| Biz Expectations: Next 6-Mos | |||||||||
| MFG | -0.5% | -2.8% | 0.9% | -1.4% | -3.0% | 100.9 | 96.4 | 104.7% | 79.1% |
| Activity (m/m) | |||||||||
| MFG | -1.8% | -3.7% | 2.0% | -0.5% | 0.4% | 102.9 | 96.9 | 106.2% | 77.8% |
| Demand M/M | |||||||||
| MFG | -3.3% | -7.1% | 0.4% | -3.6% | -1.7% | 101.2 | 97.0 | 104.3% | 68.5% |
| Orders on hand | |||||||||
| MFG | -2.7% | -3.6% | -0.9% | -3.0% | -2.7% | 104.0 | 96.4 | 107.9% | 79.0% |
| Foreign orders on hand | |||||||||
| MFG | 1.9% | 2.0% | 2.5% | 1.9% | 5.4% | 111.5 | 94.2 | 118.3% | 96.5% |
| Yr/Yr percentage changes in underlying Indices | |||||||||
| IFO outlook for 3-Months ahead | |||||||||
| 3-Mos ahead | Percent: Yr/Yr | INDEX NUMBERS | |||||||
| Expected Activity | Jul-07 | Jun-07 | May-07 | Apr-07 | Mar-07 | CURRENT | Average | Curr/Avg | Percentile |
| MFG | 1.0% | 3.4% | 0.5% | 0.7% | -1.6% | 103.0 | 96.7 | 106.5% | 94.0% |
| Orders expectations | |||||||||
| Retail Order Expectations | -1.2% | -10.8% | -4.6% | -10.9% | -10.0% | -11.6 | -17.5 | 66.5% | 70.6% |
| Wholesale | 0.7% | 5.7% | 15.7% | 15.0% | 10.7% | 7.1 | -14.0 | -50.7% | 83.1% |
| EXPORT Biz Expectations | |||||||||
| MFG | 0.0% | 0.4% | -0.5% | -1.1% | -1.9% | 103.5 | 98.3 | 105.3% | 89.4% |
| Employment Expectations | |||||||||
| MFG | 7.4% | 8.4% | 7.5% | 6.4% | 8.2% | 105.9 | 95.9 | 110.4% | 100.0% |
by Robert Brusca July 31, 2007
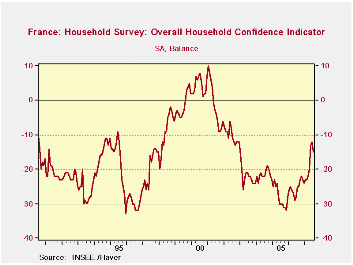
French household confidence stumbled by three points taking the aggregate reading to its lowest point since April of this year. The overall index resides near mid range among all values since 1990. Expected improvement in living standards and drops in unemployment are two of the factors boosting this index. Consumers say they have the ability to save over the next 12 months and that is an extremely strong response on their part, in the top 7 percent of this historic range. Consumers rate the times as slightly more favorable for spending than they did last month with a net response of -4 compared to -6, a value that ranks in about the top third of its range. Still, consumers rate their current financial situation as below average in only about the 42nd percentile of its range. That is a slippage from the 52nd percentile over the past 12 months; for the next 12 months, consumers expect an improvement putting their response in the 63rd percentile of its range near the upper third.
On balance, the responses by the French consumers are showing slippage. One of the main drivers holding things in place is the improvement that consumers have seen and continue to expect in unemployment. Consumers remain upbeat that their financial situation is going to improve despite this month’s slippage in the overall index.
| Since Jan 1990 | Since Jan 1990 | |||||||||
| Jul-07 | Jun-07 | May-07 | Apr-07 | Percentile | Rank | Max | Min | Range | Mean | |
| Household Confidence | -15 | -12 | -13 | -20 | 54.5 | 51 | 5 | -39 | 44 | -21 |
| Living Standards | ||||||||||
| past 12-Mos | -45 | -45 | -49 | -55 | 39.5 | 60 | 1 | -75 | 76 | -50 |
| Next 12-Mos | -9 | -3 | 0 | -16 | 71.4 | 33 | 7 | -49 | 56 | -25 |
| Unemployment: Next 12 | -9 | -9 | -12 | 4 | 16.2 | 193 | 84 | -27 | 111 | 40 |
| Price Developments | ||||||||||
| Past 12-Mos | -2 | -7 | -4 | 0 | 69.3 | 58 | 29 | -72 | 101 | -32 |
| Next 12-Mos | -28 | -30 | -43 | -35 | 35.2 | 42 | 31 | -60 | 91 | -34 |
| Savings | ||||||||||
| Favorable to save | 32 | 34 | 30 | 26 | 44.3 | 162 | 66 | 5 | 61 | 43 |
| Ability to save Next 12 | -4 | -4 | -2 | -9 | 94.4 | 3 | -2 | -38 | 36 | -20 |
| Spending | ||||||||||
| Favorable for major purchase | -4 | -6 | -9 | -12 | 67.8 | 43 | 15 | -44 | 59 | -14 |
| Financial Situation | ||||||||||
| Current | 14 | 14 | 16 | 12 | 42.9 | 79 | 26 | 5 | 21 | 14 |
| Past 12-Mos | -14 | -11 | -15 | -18 | 52.2 | 83 | -3 | -26 | 23 | -14 |
| Next 12-Mos | -1 | 3 | 7 | -1 | 63.0 | 86 | 9 | -18 | 27 | -2 |
| Number of observations in the period | 208 | |||||||||

Tom Moeller
AuthorMore in Author Profile »Prior to joining Haver Analytics in 2000, Mr. Moeller worked as the Economist at Chancellor Capital Management from 1985 to 1999. There, he developed comprehensive economic forecasts and interpreted economic data for equity and fixed income portfolio managers. Also at Chancellor, Mr. Moeller worked as an equity analyst and was responsible for researching and rating companies in the economically sensitive automobile and housing industries for investment in Chancellor’s equity portfolio. Prior to joining Chancellor, Mr. Moeller was an Economist at Citibank from 1979 to 1984. He also analyzed pricing behavior in the metals industry for the Council on Wage and Price Stability in Washington, D.C. In 1999, Mr. Moeller received the award for most accurate forecast from the Forecasters' Club of New York. From 1990 to 1992 he was President of the New York Association for Business Economists. Mr. Moeller earned an M.B.A. in Finance from Fordham University, where he graduated in 1987. He holds a Bachelor of Arts in Economics from George Washington University.
More Economy in Brief


