 Global| Feb 07 2008
U.S. Pending Home Sales Seeking a Bottom?
by:Tom Moeller
|in:Economy in Brief
Summary
The National Association of Realtors reported that the level of pending home sales in December fell 1.5% from November following that month's decline of 3.0%. These notable declines, however, followed increases during the prior two [...]
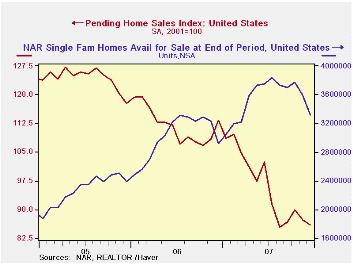
The National Association of Realtors reported that the level of pending home sales in December fell 1.5% from November following that month's decline of 3.0%. These notable declines, however, followed increases during the prior two months. The December decline therefore left sales at the cycle's low set in August. The pattern of sales since then has been essentially sideways.
Despite the sideways movement, the latest monthly figure is
about one third below the peak level during the Summer of 2005. The
data date back only to 2001.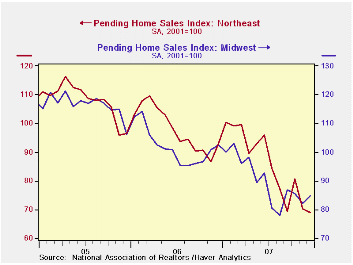
These figures are analogous to the new home sales data from the Commerce Dept. They measure existing home sales when the sales contract is signed, not at the time the sale is closed.
The Realtors also indicated in an earlier report that the number of homes on the market and available for sale fell 7.4% to 390,500 units in December. That was the lowest level since March. For all of 2007, however, the inventory of unsold homes rose 13.2% after huge increases of 21.2% and 26.8% during the prior two years.
In the Northeast, pending home sales fell 1.7% after a 13.0% m/m decline in November. For the year sales fell 12.6% following 2006's decline of 9.2%. Sales out West also fell a sharp 3.1% after a 2.1% November drop and for the year were down 15.8% after a 14.8% shortfall in 2006.
Sales in the Midwest sales ended the year with a 3.4% gain and since August have shown a very slight upward tilt. For the year sales fell 12.0% after the 12.4% 2006 decline. In the South sales fell another 3.0% in December to a new cycle low. For the year sales in the South fell 15.7% after a relatively moderate 5.5% decline in 2006.
The pending home sales data are available in Haver's PREALTOR database and the number of homes on the market are in the REALTOR database.
| Pending Home Sales (2001=100) | December | November | Y/Y | 2007 | 2006 | 2005 |
|---|---|---|---|---|---|---|
| Total | 85.9 | 87.2 | -24.2% | 95.9 | 112.1 | 124.2 |
| Northeast | 68.9 | 70.1 | -26.0 | 85.7 | 98.0 | 108.0 |
| Midwest | 84.9 | 82.1 | -17.3 | 89.7 | 102.0 | 116.4 |
| South | 96.4 | 99.4 | -27.0 | 107.4 | 127.4 | 134.8 |
| West | 83.9 | 86.6 | -24.1 | 92.3 | 109.6 | 128.7 |
by Tom Moeller February 7, 2008
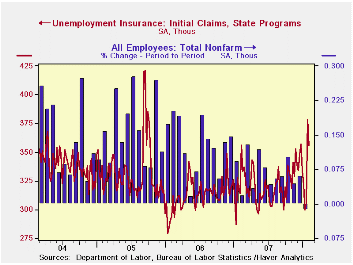
Initial claims for jobless insurance slipped 22,000 last week
to 356,000. The decline pulled back only a piece of the prior week's
upwardly revised 72,000 surge. The latest remained near the highest
level since October of 2005. 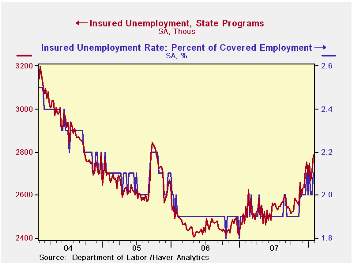
The four-week moving average of initial claims, a measure which smoothes out most of the series' w/w volatility, rose again to 335,000 (+7.5% y/y).
A claims level below 400,000 typically has been associated with growth in nonfarm payrolls. During the last ten years there has been a (negative) 76% correlation between the level of initial claims and the m/m change in nonfarm payroll employment.
Continuing claims for unemployment insurance jumped 75,000 following a 41,000 increase during the week prior. That was revised down just slightly. The figure provides some indication of workers' ability to find employment but here again difficulties of seasonal adjustment this time of year are great.
The continuing claims numbers lag the initial claims figures by one week.
The insured rate of unemployment rose w/w back to 2.1%.
Business Volatility, Job Destruction and Unemployment from the Federal Reserve Bank of San Francisco can be found here.
A Minimum Wager from the Federal Reserve Bank of Minneapolis is available here.
| Unemployment Insurance (000s) | 02/02/08 | 01/26/07 | Y/Y | 2006 | 2005 | 2004 |
|---|---|---|---|---|---|---|
| Initial Claims | 356 | 378 | 13.4% | 313 | 331 | 343 |
| Continuing Claims | -- | 2,785 | 12.8% | 2,459 | 2,662 | 2,924 |
by Robert Brusca February 7, 2008
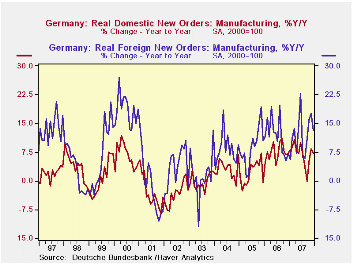
German orders for December were stronger than expected, a mild
positive surprise to markets. With the economy showing weakening
signals and the euro strong, sentiment is shifting to look for some
weaker results. As a result the spin on the numbers reported today was
to sort of set them aside as though they were something that would not
last. And, indeed, they may not last.
The German foreign orders series showed that foreign orders
from non-German Euro Area countries fell by 6.8% after a 6.7% rise in
November. This also raises questions about what is going on within the
Euro Area (EA). Foreign orders at German firms from outside the EA rose
by 0.8% in the month after falling in November.
One thing to understand is that Germany is the STRONGEST of
the EA economies. Other EA countries will be feeling pain before
Germany does. We can see this by looking at one measure of
competitiveness, prices. HICP prices in Germany have fallen by 11.5%
relative to the EA average since January of 1996. Compare this to Italy
where its HICP has risen by 3.7% or Spain where its prices have risen
relative to the average by 12.2%. That sort of result implies a huge
difference in competitiveness for trade both within the EA and outside
it. It should come as no surprise that confidence in Italy and Spain
has been lagging.
German data are reliable and timely. For other countries we are not always so lucky. But if we piece together the things we know about Germany and the geographic data in reports like today’s orders, there is a real reason to be wary of EA growth going forward. There is the additional unsavory point that Germany itself may be living a bit on borrowed time. Its firms may have employed FX hedges to lock in past more favorable exchange rates on which to do business. But these devices eventually fail in their ability to afford a safe haven or even partial escape. A lot of hedging is done on a six-month horizon and six months ago the euro value Vs the dollar was at $1.34 Compared to the current $1.45 to $1.50 rate. A year ago, a fairly long period over which to hedge the euro rate Vs the dollar was at $1.30. Obviously if hedges set at those times are running off German firms would have to begin to confront business prospects at current exchange rates. Interestingly it is the intra-EA orders that are the weakest for Germany. But it still has a good chunk of business in capital goods that might be a bit less price elastic in Eastern Europe and in Russia. It is no surprise in view of these emerging risks, that ECB president Trichet softened the rhetoric in his remarks today.
| German Orders and Sales By Sector and Origin | |||||||
|---|---|---|---|---|---|---|---|
| Real and SA | % M/M | % Saar | |||||
| Dec-07 | Nov-07 | Oct-07 | 3-MO | 6-Mo | 12-Mo | YrAgo | |
| Total Orders | -1.7% | 3.0% | 4.0% | 22.5% | 10.7% | 10.2% | 7.3% |
| Foreign | -2.8% | 2.3% | 5.3% | 20.1% | 9.6% | 13.2% | 7.2% |
| Domestic | -0.5% | 3.7% | 2.5% | 25.3% | 11.9% | 7.3% | 7.2% |
| Sector Sales | |||||||
| Manufacturing/Mining | 0.2% | -0.7% | 1.3% | 3.0% | 1.5% | 4.4% | 7.8% |
| Consumer | -0.4% | -0.6% | 0.8% | -0.8% | -0.4% | 1.7% | 3.4% |
| Consumer Durables | 2.6% | -0.2% | -1.3% | 4.1% | 2.1% | 1.3% | 10.0% |
| Consumer Nondurables | -0.9% | -0.6% | 1.1% | -1.5% | -0.8% | 1.8% | 2.1% |
| Capital Goods | -0.2% | -2.1% | 3.3% | 3.4% | 1.7% | 6.8% | 6.7% |
| Intermediate Goods | 0.9% | 0.8% | -0.6% | 4.3% | 2.1% | 3.0% | 12.1% |
| All Manufacturing Sales | 0.2% | -0.9% | 1.2% | 2.0% | 1.0% | 3.8% | 7.4% |
by Robert Brusca February 7, 2008
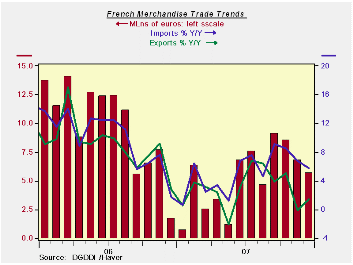
The French trade trends show a declining profile in both the
export and import rates of growth. French export growth shows faltering
growth trends across its main categories except motor vehicles that
rose over three months as well as year/year. French imports were off
sharply in the recent month. But trends over the past year are still
showing growth. Over three months, however, the main trade categories
are showing declines and posting negative rates of growth.
The message from these statistics is that France and its main
trade partners is slowing. Remember that Euro Area (EA) countries’
foreign trade numbers are tricky to interpret since any trade with
another country is ‘foreign’ but trade that remains within the EA is
without direct foreign exchange consequences. So for EA countries not
all foreign trade is created equal. For France the picture is
nonetheless one of faltering flows.
| French Trade trends for goods | |||||
|---|---|---|---|---|---|
| m/m% | % Saar | ||||
| Dec-07 | Nov-07 | 3M | 6M | 12M | |
| Balance* | -€€ 4,279.00 | -€€ 4,616.00 | -€€ 4,174.67 | -€€ 3,708.67 | -€€ 3,249.42 |
| Exports | |||||
| All Exports | -0.8% | -1.2% | -6.5% | -2.7% | 1.3% |
| Capital Goods | -2.6% | -0.8% | -21.3% | -4.9% | -1.3% |
| Motor Vehicles | 2.7% | -3.5% | 4.6% | 2.1% | 4.6% |
| Consumer Goods | -0.8% | 0.0% | -13.8% | -2.6% | -2.1% |
| Imports | |||||
| All Imports | -1.3% | 1.6% | 2.5% | 2.4% | 5.7% |
| Capital Goods | -4.5% | -0.3% | -19.8% | -8.8% | 1.1% |
| Motor Vehicles | -3.9% | 2.3% | -0.2% | -0.9% | 8.0% |
| Consumer Goods | -4.6% | 1.5% | -22.6% | -7.3% | -0.5% |
| *Eur mlns; mo or period average | |||||
by Robert Brusca February 7, 2008
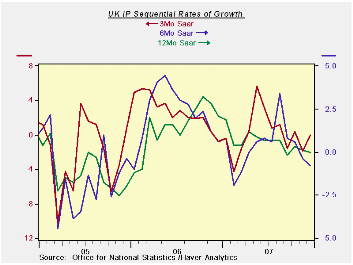
UK industrial production slowed sharply in December and major
trends are all pointing lower. IP in December was weaker than had been
assumed in the UK GDP report, raising the possibility that GDP could be
revised lower. The quarterly growth rate for manufacturing is -0.4% in
Q4. The sequential growth rates from 12 months to 6 months to 3 months
show a slowing across manufacturing components with the exception of
capital goods. Detailed sectors show food and drink, textile and
leather and motor vehicle sectors in a progressive state of decline and
deceleration. The quarter’s growth rate for these components is deeply
negative and so would the overall result if it were not for strength in
the utilities output and some growth in mining and quarrying.
| UK IP and MFG | ||||||||||
|---|---|---|---|---|---|---|---|---|---|---|
| Saar except m/m | Mo/Mo | Dec 07 |
Nov 07 |
Dec 07 |
Nov 07 |
Dec 07 |
Nov 07 |
|||
| UK Manufacturing | Dec 07 |
Nov 07 |
Oct 07 |
3mo | 3mo | 6mo | 6mo | 12mo | 12mo | Q-4 Date |
| Manufacturing | -0.2% | -0.1% | 0.3% | 0.0% | -1.9% | -0.8% | -0.4% | 0.0% | 0.1% | -0.5% |
| Consumer Goods | ||||||||||
| Consumer Durables | 1.5% | -1.4% | -1.0% | -3.8% | -16.1% | -3.0% | 0.6% | -3.0% | -4.1% | -10.1% |
| Consumer Nondurables | -0.4% | -0.1% | 0.1% | -1.6% | -1.2% | -0.2% | -0.8% | -1.6% | -0.4% | -0.7% |
| Intermediate Goods | -0.4% | -0.1% | 0.7% | 0.8% | 0.0% | -1.3% | -0.8% | 1.5% | 0.8% | 0.0% |
| Capital Goods | 0.6% | 0.1% | 0.7% | 6.0% | 1.5% | 1.3% | 0.7% | 2.3% | 0.7% | 3.6% |
| Memo: Detail | 1Mo% | 1Mo% | 1-Mo% | 3mo | 3mo | 6mo | 6mo | 12mo | 12mo | Q-4 Date |
| Food Drink & Tobacco | -0.3% | 0.0% | -0.5% | -3.1% | -2.3% | -0.8% | -0.4% | -1.6% | -0.5% | -2.5% |
| Textile & Leather | -1.2% | -0.9% | -0.1% | -8.5% | -10.4% | -8.0% | -2.5% | -3.1% | -0.8% | -9.2% |
| Motor Vehicles & Trailer | 0.8% | 0.3% | -2.7% | -6.4% | -14.9% | 3.8% | 9.5% | 9.4% | 7.0% | -8.1% |
| Mining and Quarry | 0.3% | -1.6% | 2.7% | 5.5% | 1.6% | -2.3% | -5.1% | 4.0% | 0.0% | 1.1% |
| Electricity, Gas & Water | 0.6% | 1.1% | 0.2% | 7.9% | 10.2% | 5.8% | 3.3% | 3.7% | 2.9% | 7.2% |

Tom Moeller
AuthorMore in Author Profile »Prior to joining Haver Analytics in 2000, Mr. Moeller worked as the Economist at Chancellor Capital Management from 1985 to 1999. There, he developed comprehensive economic forecasts and interpreted economic data for equity and fixed income portfolio managers. Also at Chancellor, Mr. Moeller worked as an equity analyst and was responsible for researching and rating companies in the economically sensitive automobile and housing industries for investment in Chancellor’s equity portfolio. Prior to joining Chancellor, Mr. Moeller was an Economist at Citibank from 1979 to 1984. He also analyzed pricing behavior in the metals industry for the Council on Wage and Price Stability in Washington, D.C. In 1999, Mr. Moeller received the award for most accurate forecast from the Forecasters' Club of New York. From 1990 to 1992 he was President of the New York Association for Business Economists. Mr. Moeller earned an M.B.A. in Finance from Fordham University, where he graduated in 1987. He holds a Bachelor of Arts in Economics from George Washington University.
More Economy in Brief


